Financial Projections Template for a Business Plan (with Sample)

All articles
A financial projections template is a ready-made structure for forecasting your business’s sales, costs, cash and profit over the next three to five years. For a business plan it should produce three reports (a profit and loss forecast, a cash flow forecast and a balance sheet forecast) backed by a short page of assumptions that explains where every number came from.
Lenders and investors read these projections to decide whether your business can pay its bills, repay debt and grow. You will use them too, to spot a cash shortfall months before it happens.
- How far ahead: three to five years, with monthly figures for at least the first 12 months.
- What it produces: a profit and loss forecast, a cash flow forecast and a balance sheet forecast.
- What feeds it: your assumptions, sales forecast, start-up costs, running costs, staff costs and funding.
Build your financial projections in Brixx
Get started with our forecasting software so that you can plan your business' future
Start your free trialWhat to include in your financial projections template
Every projection is built from the same nine parts. The first six are the inputs you gather; the last three are the reports they produce.
- Assumptions. The handful of figures everything else depends on: prices, customer numbers, growth rate, payment terms and your opening date.
- Sales forecast. Monthly revenue by product or service. See our guide to sales forecasting.
- Cost of sales. The direct costs of each sale, such as stock, materials or payment fees.
- Running costs. Rent, utilities, insurance, software, marketing and other overheads.
- Staff costs. Salaries, employer’s National Insurance, pensions and when each hire starts.
- Start-up costs and funding. What you need to spend before you open, and where the money comes from. See estimating your start-up costs.
- Profit and loss forecast. Whether the business makes a profit, and when.
- Cash flow forecast. How much cash you hold each month, and whether it ever runs out.
- Balance sheet forecast. What the business owns, what it owes and what it is worth.
A sample financial projection for a business plan
Here is a simplified three-year projection for a new coffee shop. The figures are illustrative, but the structure is exactly what a lender or investor expects to see.
Assumptions
- Opens in January with an average of 125 customers a day, 300 trading days a year.
- Average spend of £4.80 per customer, so first-year sales of £180,000.
- Sales grow 20% in year two and 15% in year three.
- Cost of sales (coffee, milk, food, cups) is 30% of sales, giving a 70% gross margin.
- Funded by £30,000 from the owner and a £40,000 bank loan.
Profit and loss summary
| Year 1 | Year 2 | Year 3 | |
|---|---|---|---|
| Sales | £180,000 | £216,000 | £248,400 |
| Cost of sales | £54,000 | £64,800 | £74,520 |
| Gross profit | £126,000 | £151,200 | £173,880 |
| Rent | £30,000 | £30,000 | £31,000 |
| Staff | £70,000 | £75,000 | £79,000 |
| Other overheads | £15,000 | £16,000 | £17,000 |
| Operating profit | £11,000 | £30,200 | £46,880 |
Start-up costs and funding
| Start-up costs | Funding | ||
|---|---|---|---|
| Shop fit-out | £35,000 | Owner’s investment | £30,000 |
| Equipment | £15,000 | Bank loan | £40,000 |
| Opening stock | £3,000 | ||
| Deposit and legal fees | £7,000 | ||
| Total | £60,000 | Total | £70,000 |
The £10,000 difference is a cash buffer for the first few months, when sales are still building. A reader will check three things in a projection like this: that year one is profitable at all, that the growth assumptions are realistic, and that the cash flow forecast never dips below zero once loan repayments start.
How to build your financial projections, step by step
- Write down your assumptions first. If a number changes later, you change it in one place.
- Forecast sales month by month. Start from customers and prices, not from a target figure. With no trading history, see how to forecast with no historical data.
- Add cost of sales and running costs. Tie cost of sales to sales so they move together.
- Add staff with realistic start dates and on-costs.
- List start-up costs and funding, including loan repayment terms.
- Produce the three reports. In a spreadsheet you link these by formula; forecasting software builds them for you.
- Test it. Ask what happens if sales come in 20% lower or a big cost arrives early. See sensitivity analysis.
The three reports your template must produce
Each report shows the same business from a different angle. Together they answer the three questions every reader has: is it profitable, will it run out of cash, and how risky is it?
1. Cash flow forecast
The cash flow forecast records when money actually enters and leaves your bank account. This matters because profit and cash arrive at different times. An electrician who invoices for a job today records the sale in the profit and loss straight away, but the cash only appears in the cash flow when the customer pays a month later.
That delay between making a sale and being paid is what makes the cash flow forecast so useful. Even large, established businesses can fail through a lack of ready cash, and a forecast lets you see the tight months coming and act before they arrive. Our cash flow statement template shows the layout.

Questions the cash flow forecast answers
- How much cash the business holds at the end of every month.
- What happens if a project, payment or purchase happens earlier or later than planned.
- Which activities are adding cash and which are draining it.
- Whether the business will stay afloat.
Cash flows from operating activities
The day-to-day running of the business: income from sales, minus the cost of those sales, minus overheads such as rent, utilities, salaries and interest.

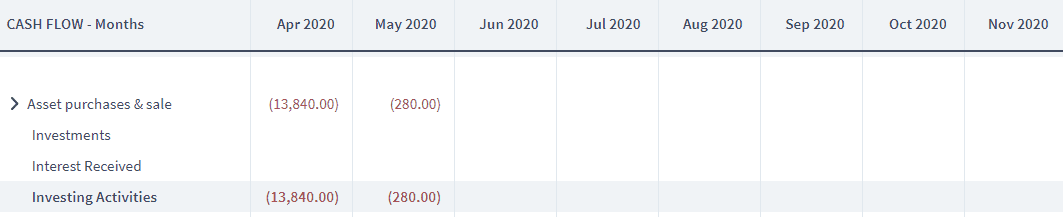
Cash flows from investing activities
Buying and selling assets such as equipment, vehicles and investments, plus interest earned on savings. These are usually one-off payments rather than part of your monthly trading, but a start-up often needs several of them before it can open.
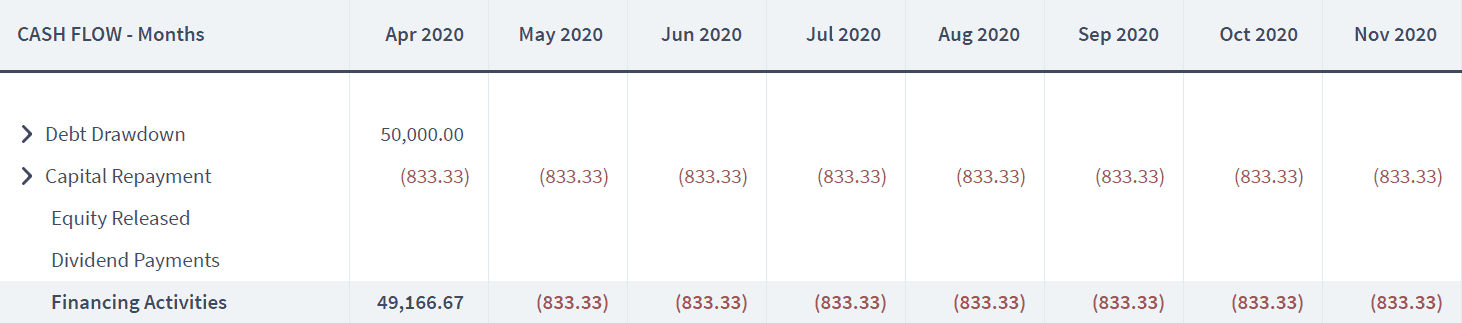
Cash flows from financing activities
Where the business gets its funding: loans, investment and grants coming in, and loan repayments and dividends going out.
Tax
The tax you pay, such as VAT and Corporation Tax, and any refunds you receive.
Income less payments and closing bank position
Income less payments is the net cash movement in each month, the total of all the cash flows above. It quickly shows the problem months of the year. The closing bank position is the real bottom line: the cash in your bank at the end of each month. If it goes negative, the business has a serious problem. Splitting out the different cash flows also shows where the pressure comes from. A business can have healthy trading cash flow while spending on equipment drains the bank faster than it can sustain.

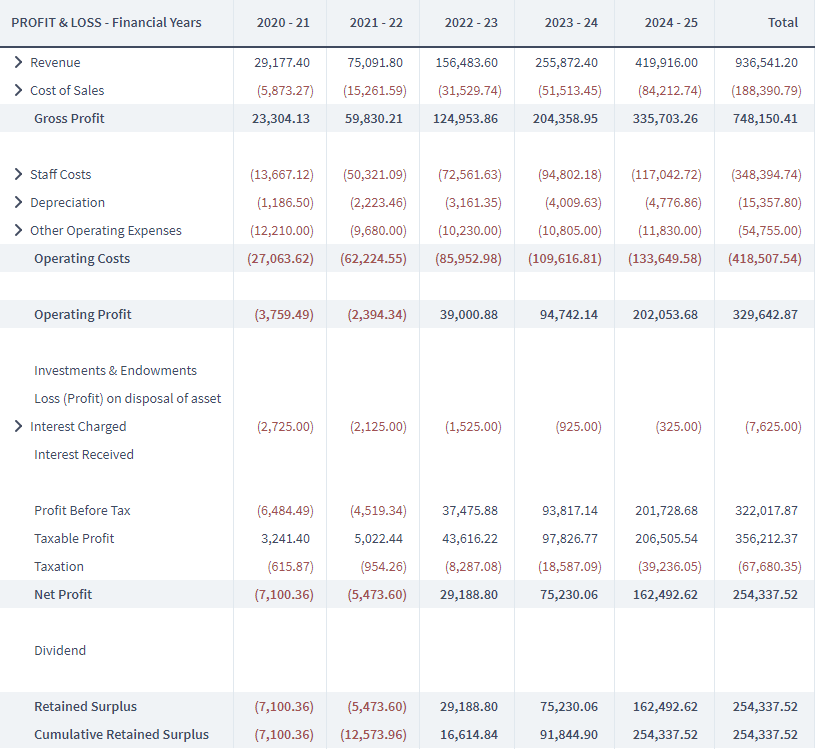
2. Profit and loss forecast
The profit and loss forecast records sales and costs when they are agreed, not when cash changes hands. It also captures losses that involve no cash at all, such as equipment losing value over time (depreciation).
Questions the profit and loss forecast answers
- What are the business’s gross profit, operating profit and net profit for a given period?
- Can the business afford to take on a new project or hire?
- What non-cash costs, such as depreciation, is the business carrying?
- How much profit is available to pay dividends?
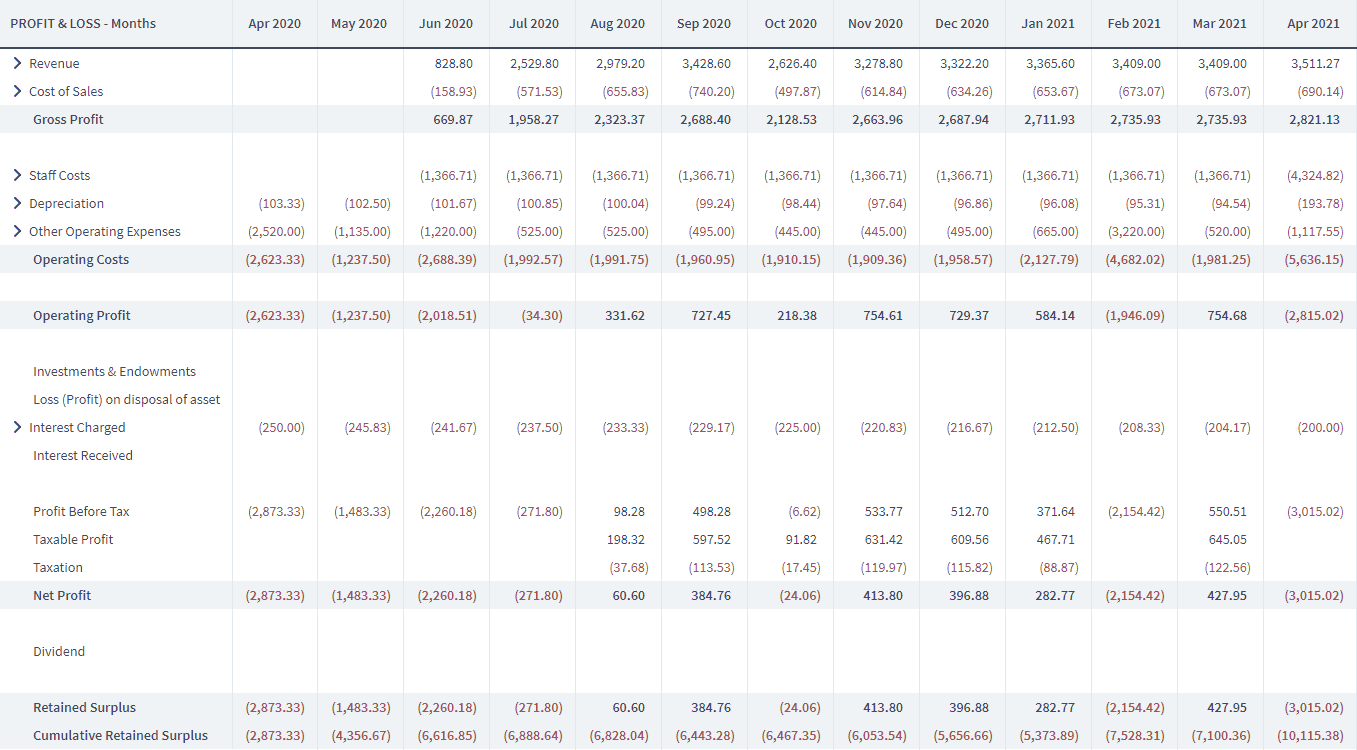
Gross profit
Sales minus the direct costs of those sales. Expressed as a percentage of sales, it becomes your gross margin, which shows how much of every pound of sales is left to cover overheads.
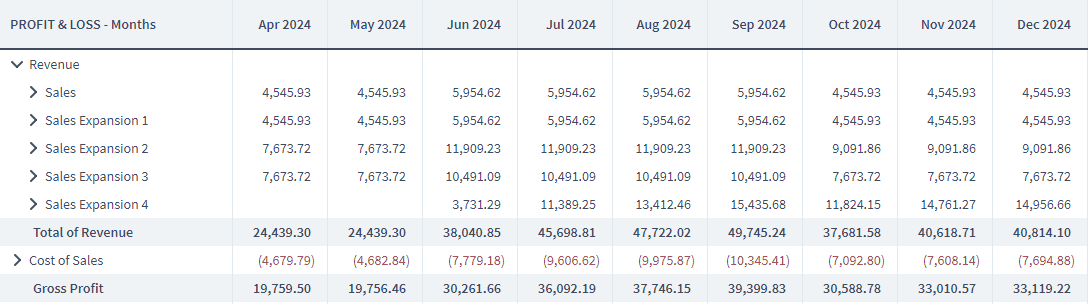
Operating profit
Gross profit minus overheads such as rent, salaries and marketing. It shows whether the business can support itself from its trading alone, which makes it a good test of whether you can afford to take on something new.
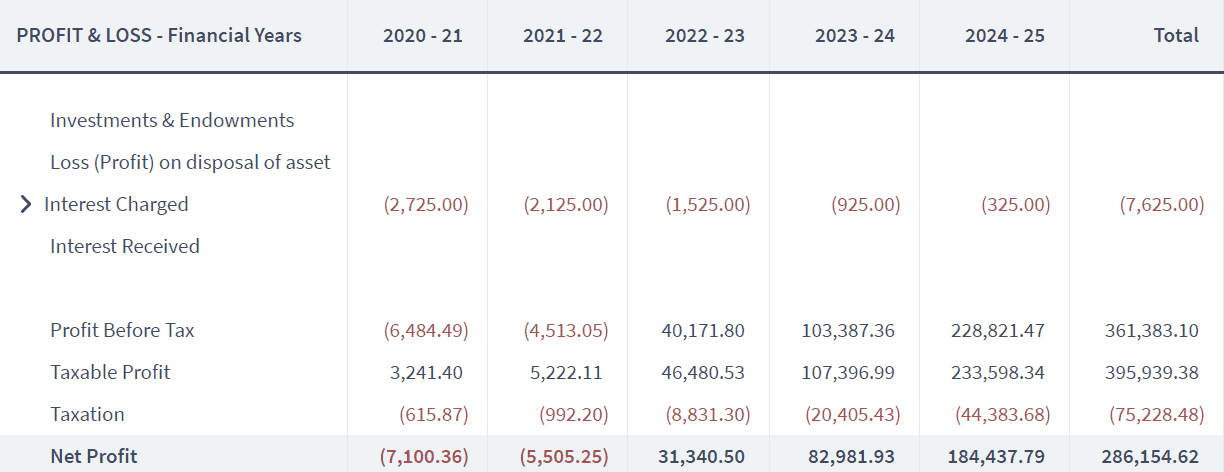
Net profit
Operating profit after everything else: interest paid and received, depreciation and tax. This is the figure left for the owners.
See our profit and loss statement template, and if the report still feels confusing, this guide explains why.
3. Balance sheet forecast
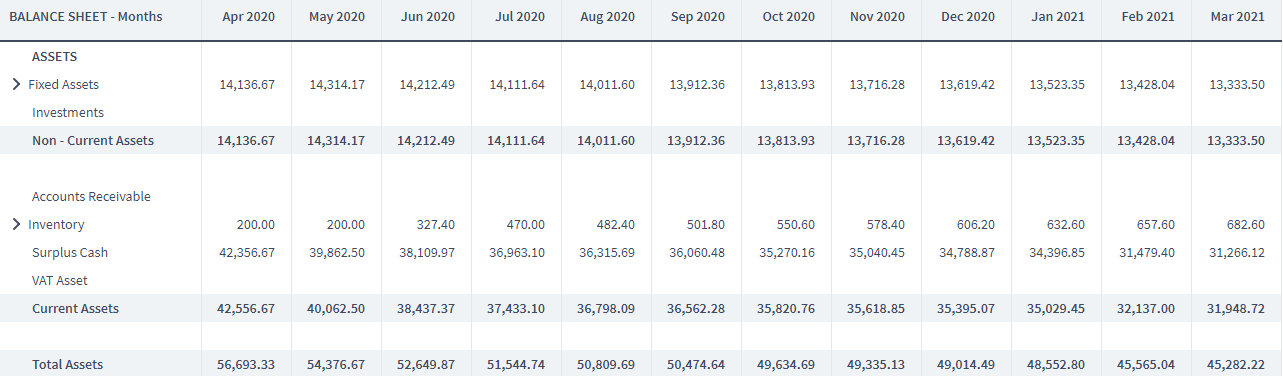
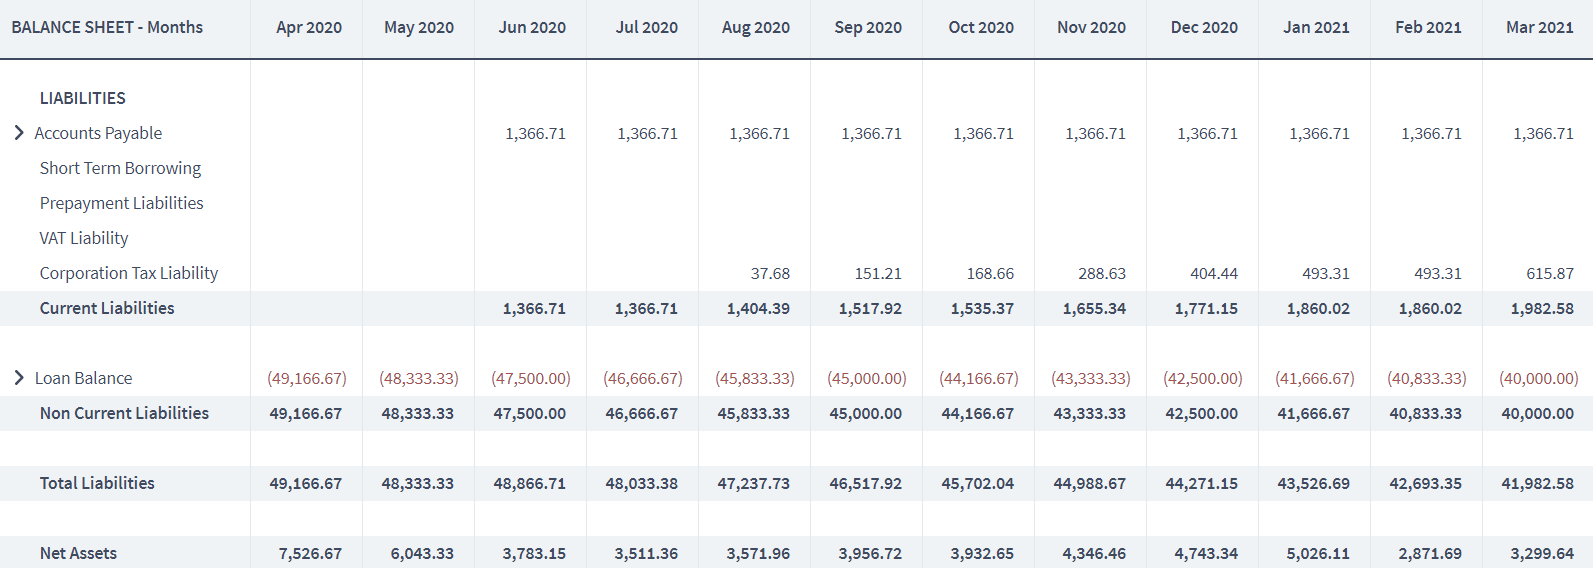
The balance sheet shows the financial position of the business at a point in time: what it owns (assets), what it owes (liabilities) and the money invested in it (equity). In plain terms it answers: how risky is this business? See our balance sheet template.
Questions the balance sheet answers
- What are the business’s assets worth?
- How much debt does it carry?
- Is it funded mainly by debt or by investment?
- How risky is it for an investor or lender?
Assets
What the business owns: physical things such as equipment and vehicles, plus cash, money owed by customers and investments.
Liabilities
What the business owes: loans, money owed to suppliers, tax due and other bills. A business with large liabilities compared with its assets looks risky, because debts must be repaid whatever state the business is in.
Equity
The net value of the business: assets minus liabilities. It also shows who owns the business, whether that is a single owner or a group of investors. From these three reports, you or your accountant can work out almost any other figure a lender or investor asks for.
Why project five years ahead?
Nobody can forecast five years accurately, and nobody expects you to. The point is not precision; it is to show what the business looks like once it is established rather than only during its first difficult year. A five-year view also lets you plan when to hire, when to expand and when debt will be repaid. See how long a financial forecast should be.
Test your projections before you share them
Investors will ask “what if?” What if sales are slower, a key hire leaves or a piece of equipment fails? If each part of your projection is a separate building block, you can change one assumption and see the knock-on effect on profit and cash straight away. Keep your supporting evidence (market research, quotes, CVs of key staff) ready for the appendix of your business plan. When you are ready to present, see how to present your financial projections and our investor pitch deck guide.
Frequently asked questions
How many years should financial projections cover?
Three to five years is standard for a business plan, with monthly figures for the first 12 months and yearly or quarterly figures after that. Some lenders only ask for 12 months, but a longer view shows the business once it has matured.
What is the difference between a financial projection and a financial forecast?
The terms are often used interchangeably. Strictly, a forecast is your best estimate of what will happen, while a projection shows what would happen under a particular set of assumptions, such as a new product launch or a loan. A business plan usually contains both.
Can I build financial projections in Excel?
Yes, and many people start there. The risk is that linking the three reports by hand is time-consuming and easy to break when you change an assumption. Forecasting software such as Brixx builds the reports for you and keeps them in balance.
What do investors look for in financial projections?
Realistic sales assumptions they can check, a clear path to profit, a cash flow that never runs out, and evidence that you have thought about what could go wrong. Overly optimistic growth is the most common reason projections are dismissed.
How do I make financial projections for a startup with no trading history?
Build from the bottom up: estimate customer numbers, prices and costs from market research, competitor data and supplier quotes, and state each assumption clearly so a reader can judge it. Our guide to forecasting with no historical data walks through it.
Plan beyond the business plan
Your projections are useful long after the business plan is written. Compare them with your actual results each month, update them when things change, and use them to decide when you can afford to grow. Brixx for start-ups turns your assumptions into all three reports and lets you test different scenarios side by side.