Income
Spot tight months before they happen
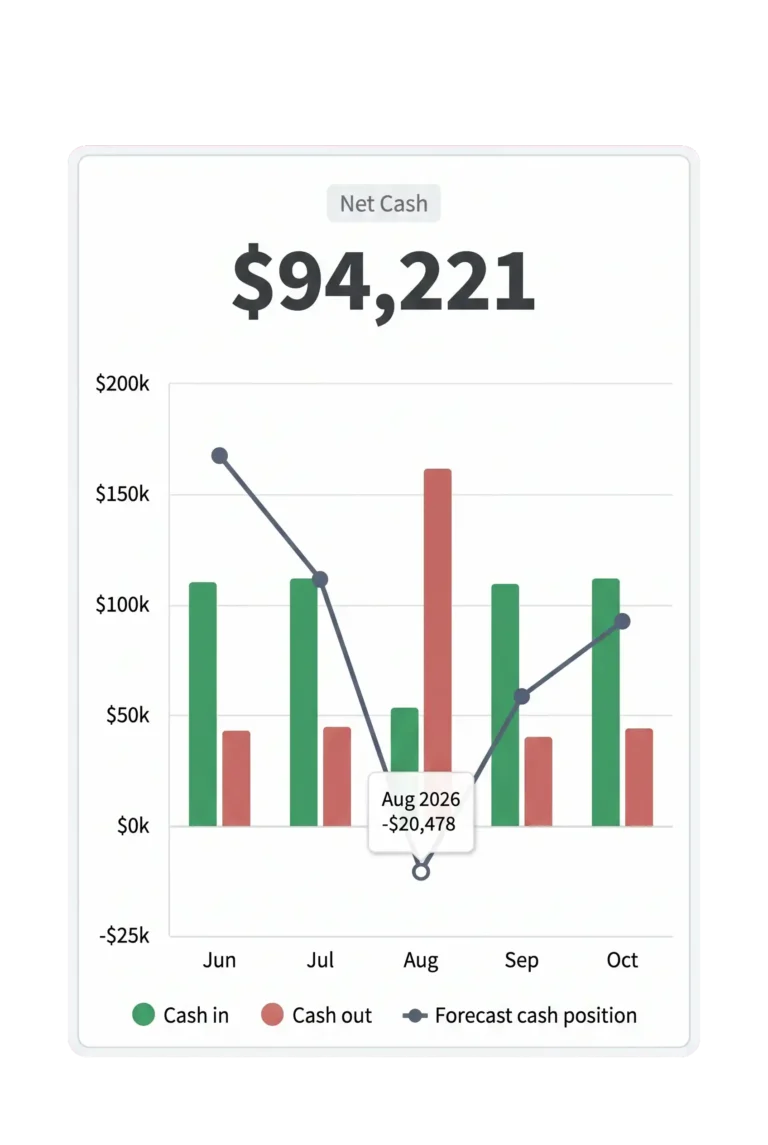
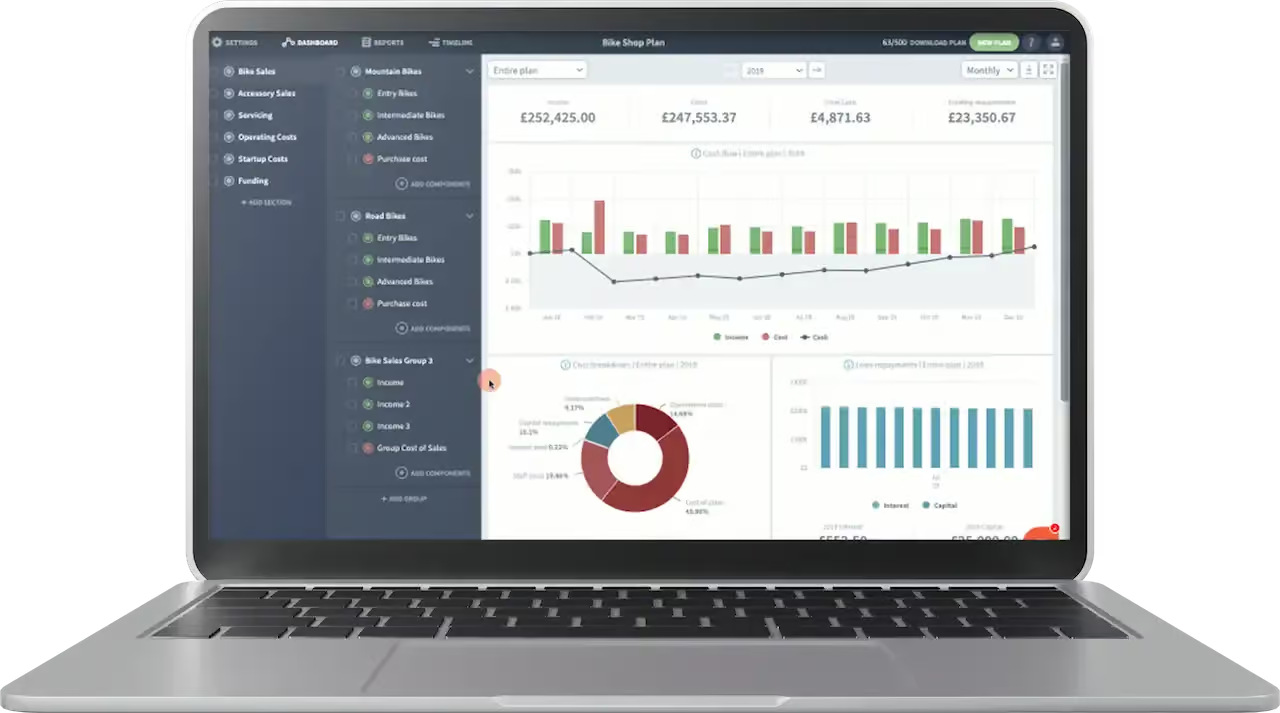
Forecast your cash flow month by month, so you can spot shortfalls early and make decisions with your eyes open.
One place to see what’s coming in, what’s going out, and what you’ll have left.
Spot tight months before they happen
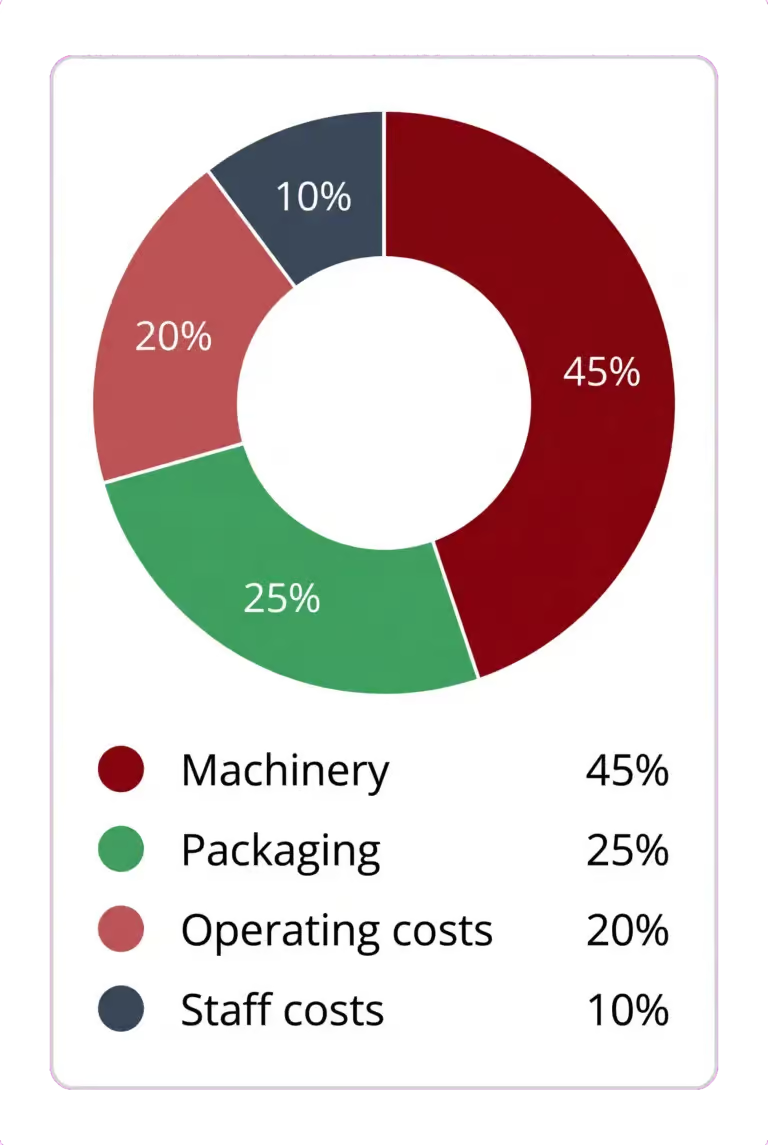
Capture all costs clearly and see how they affect your cash position.
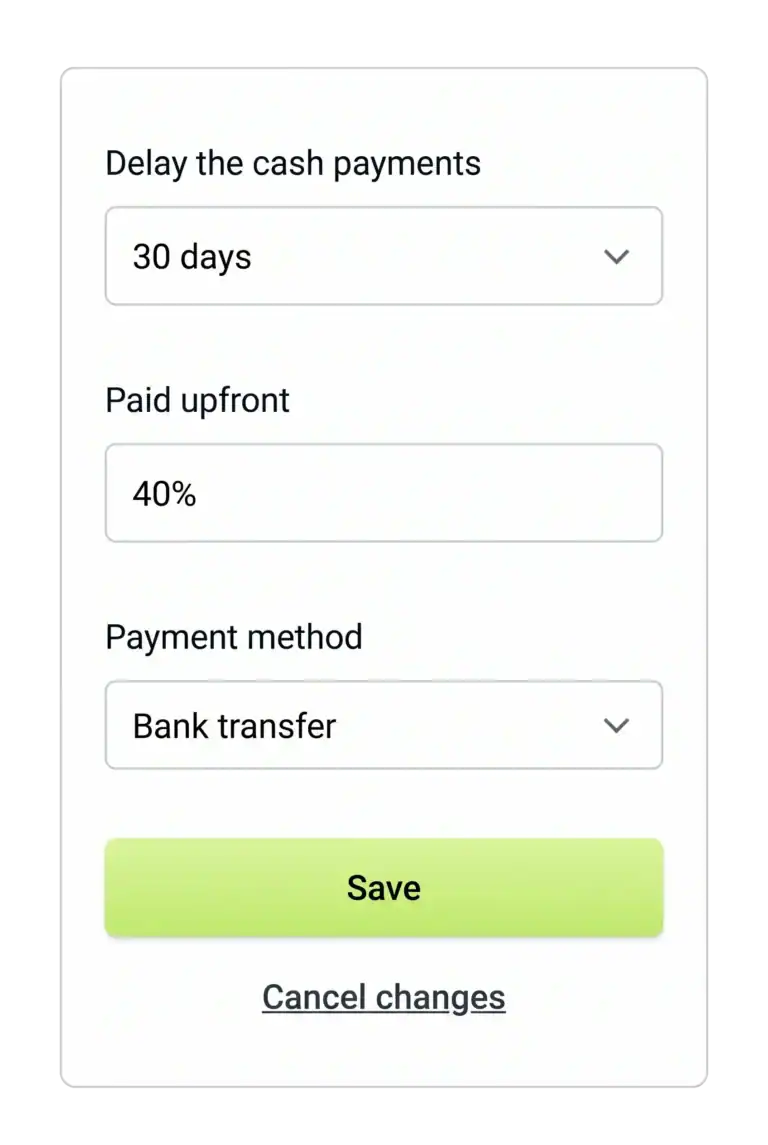
Model payment terms for every transaction and avoid nasty surprises.
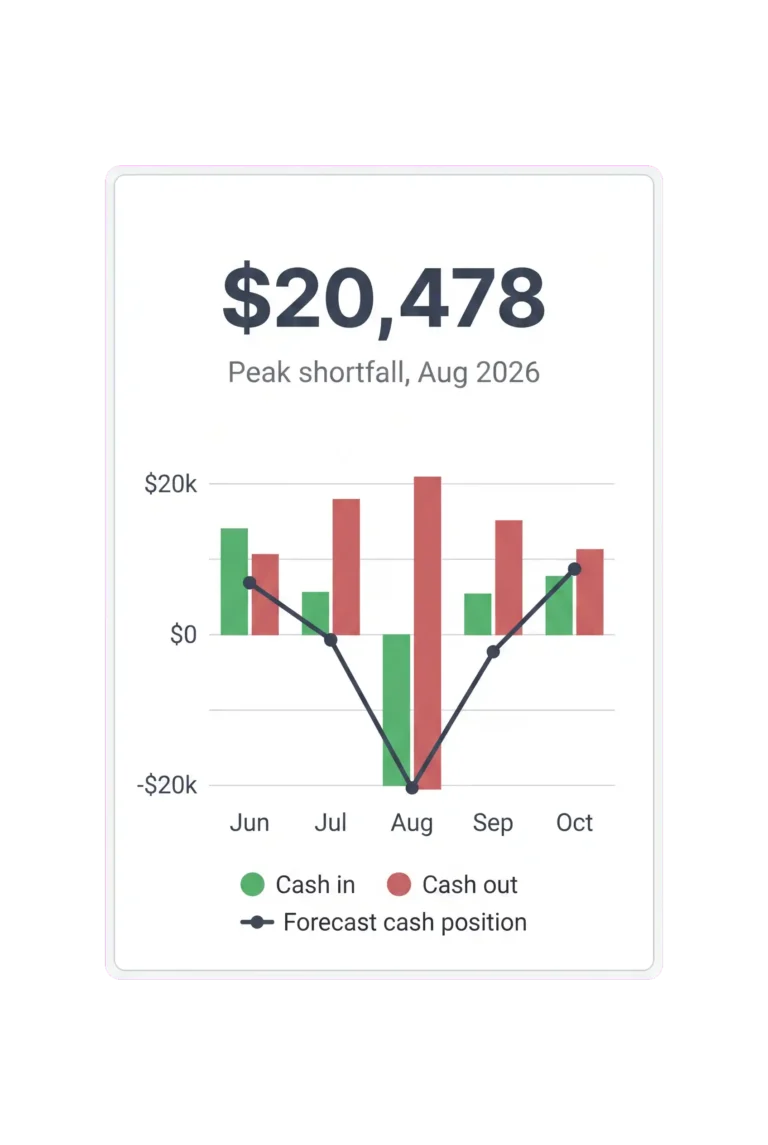
See when you’ll need funding and how much
Plan ahead with a clear, living forecast that updates fast and shows exactly what drives your cash position.

See cash gaps early, not at the last minute.
You don’t need to be a spreadsheet wizard to build a long-term monthly cash flow projection.
Spin up multiple plans. Toggle options on and off. Compare scenarios without rebuilding your spreadsheet from scratch.
All revenue streams
Recurring income forecasts
One clear timeline
See peaks and dips
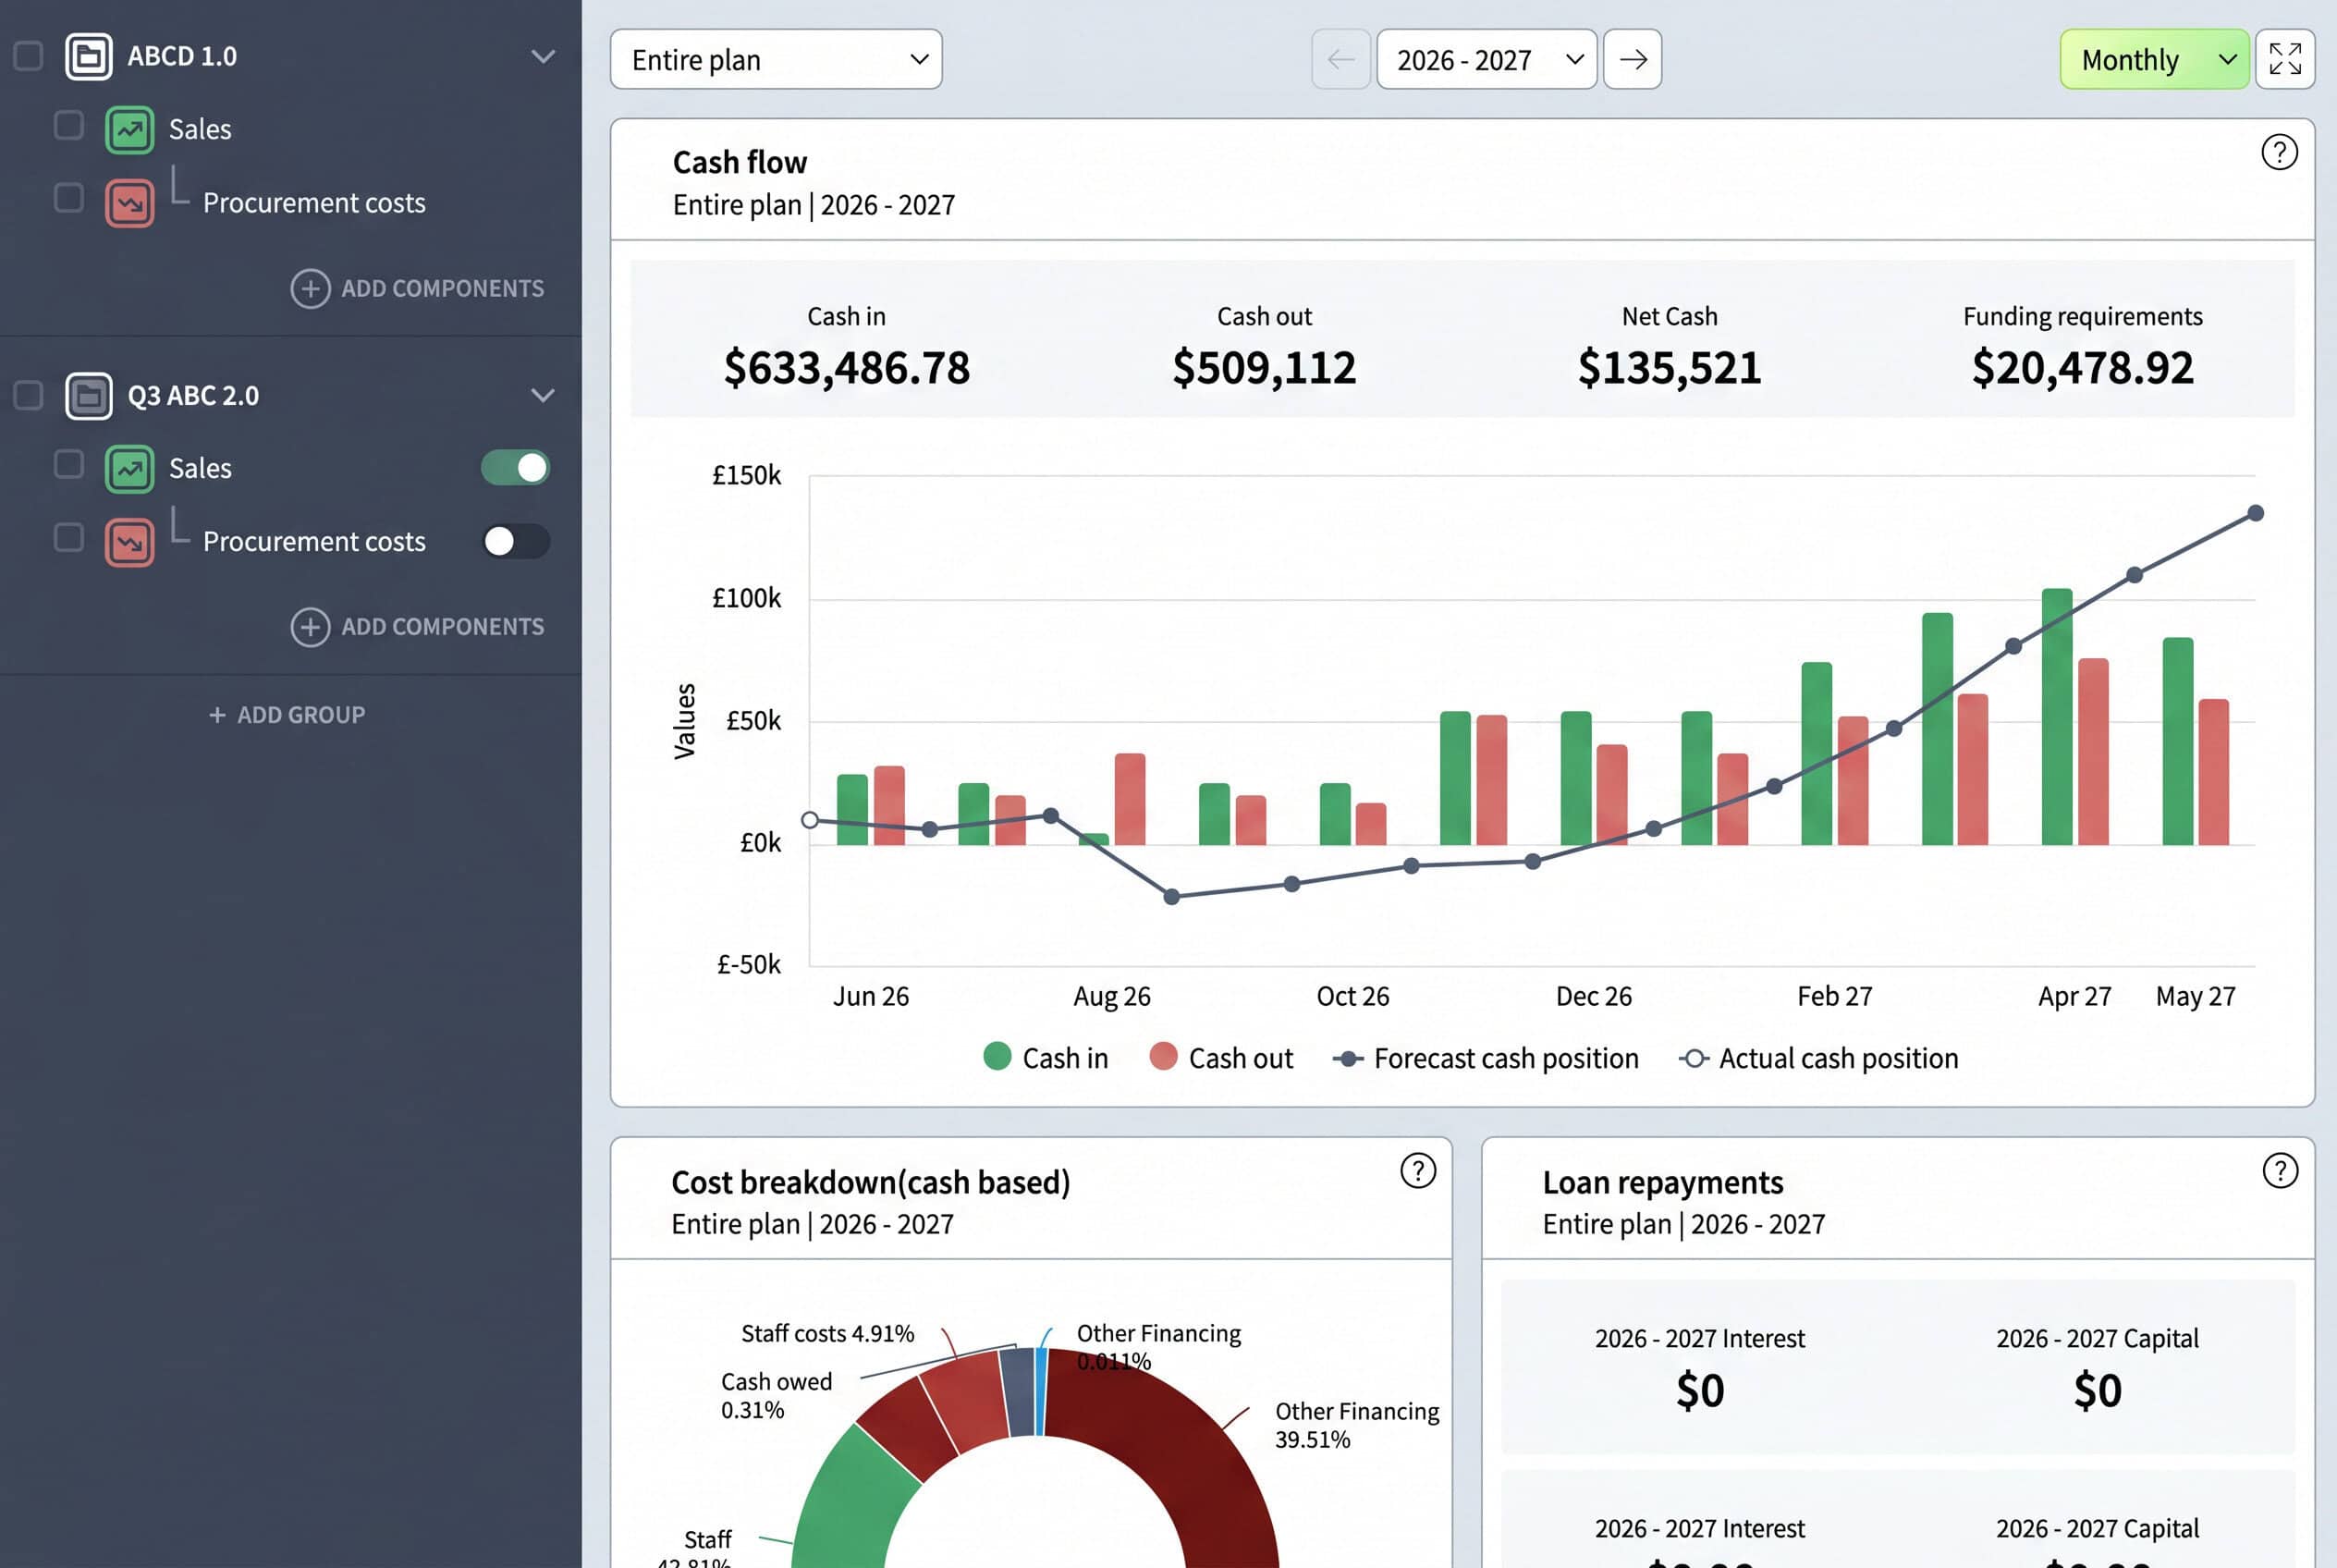
Model payment terms to see when money really moves, not just when invoices are raised or bills are due.
Payment terms modelled
Impact of late payments
Change dates in seconds
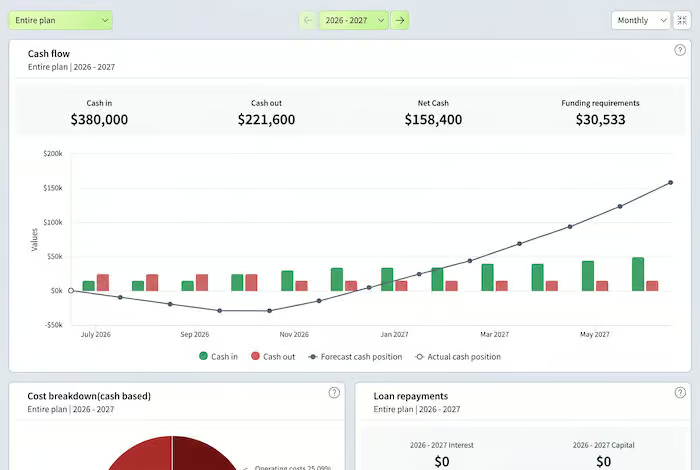
Plan asset purchases and depreciation with clarity, so big spends never surprise your cash position or financial picture.
Track asset purchases
Model vehicles and equipment over time
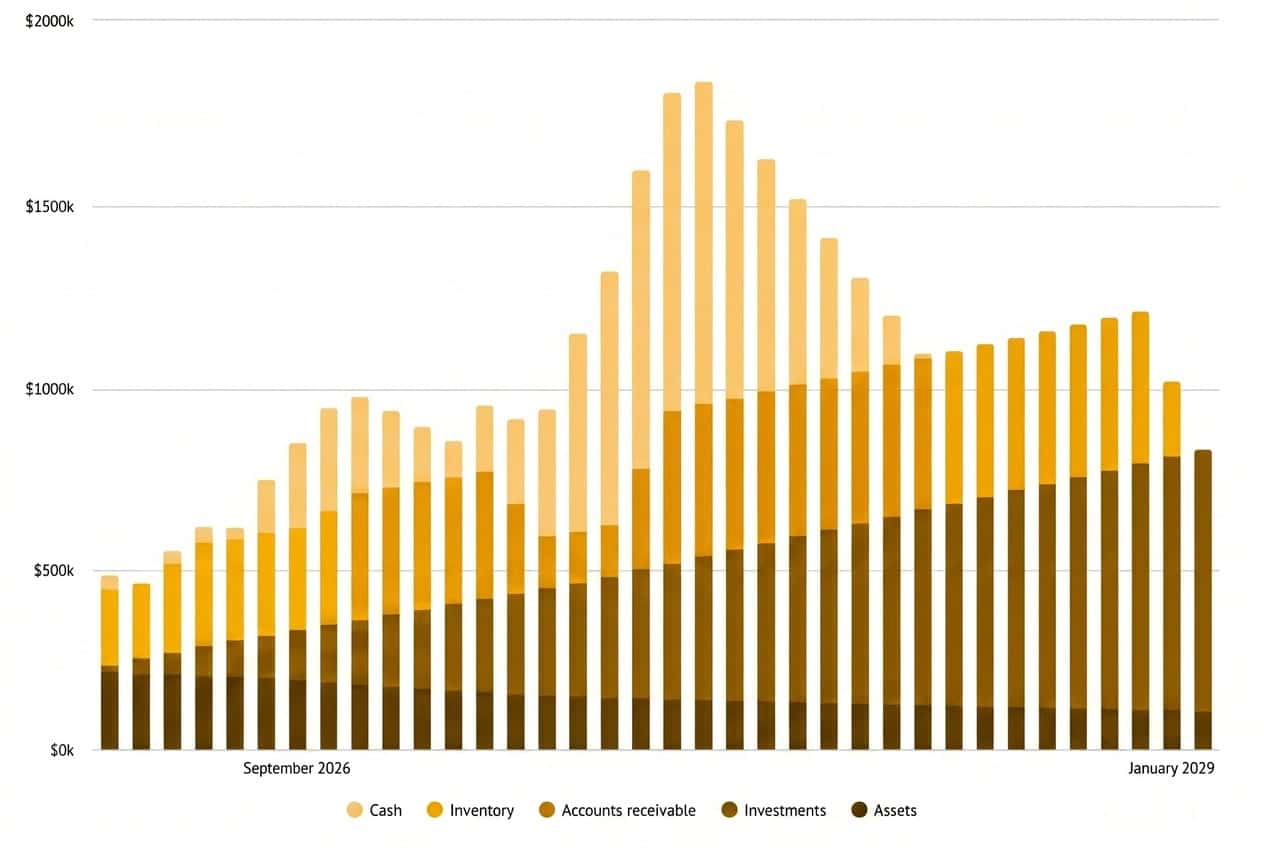
Know your funding needs before they hit, and test different options to keep your plan on track.
Funding gaps highlighted
Model loans and equity
Repayments forecasted
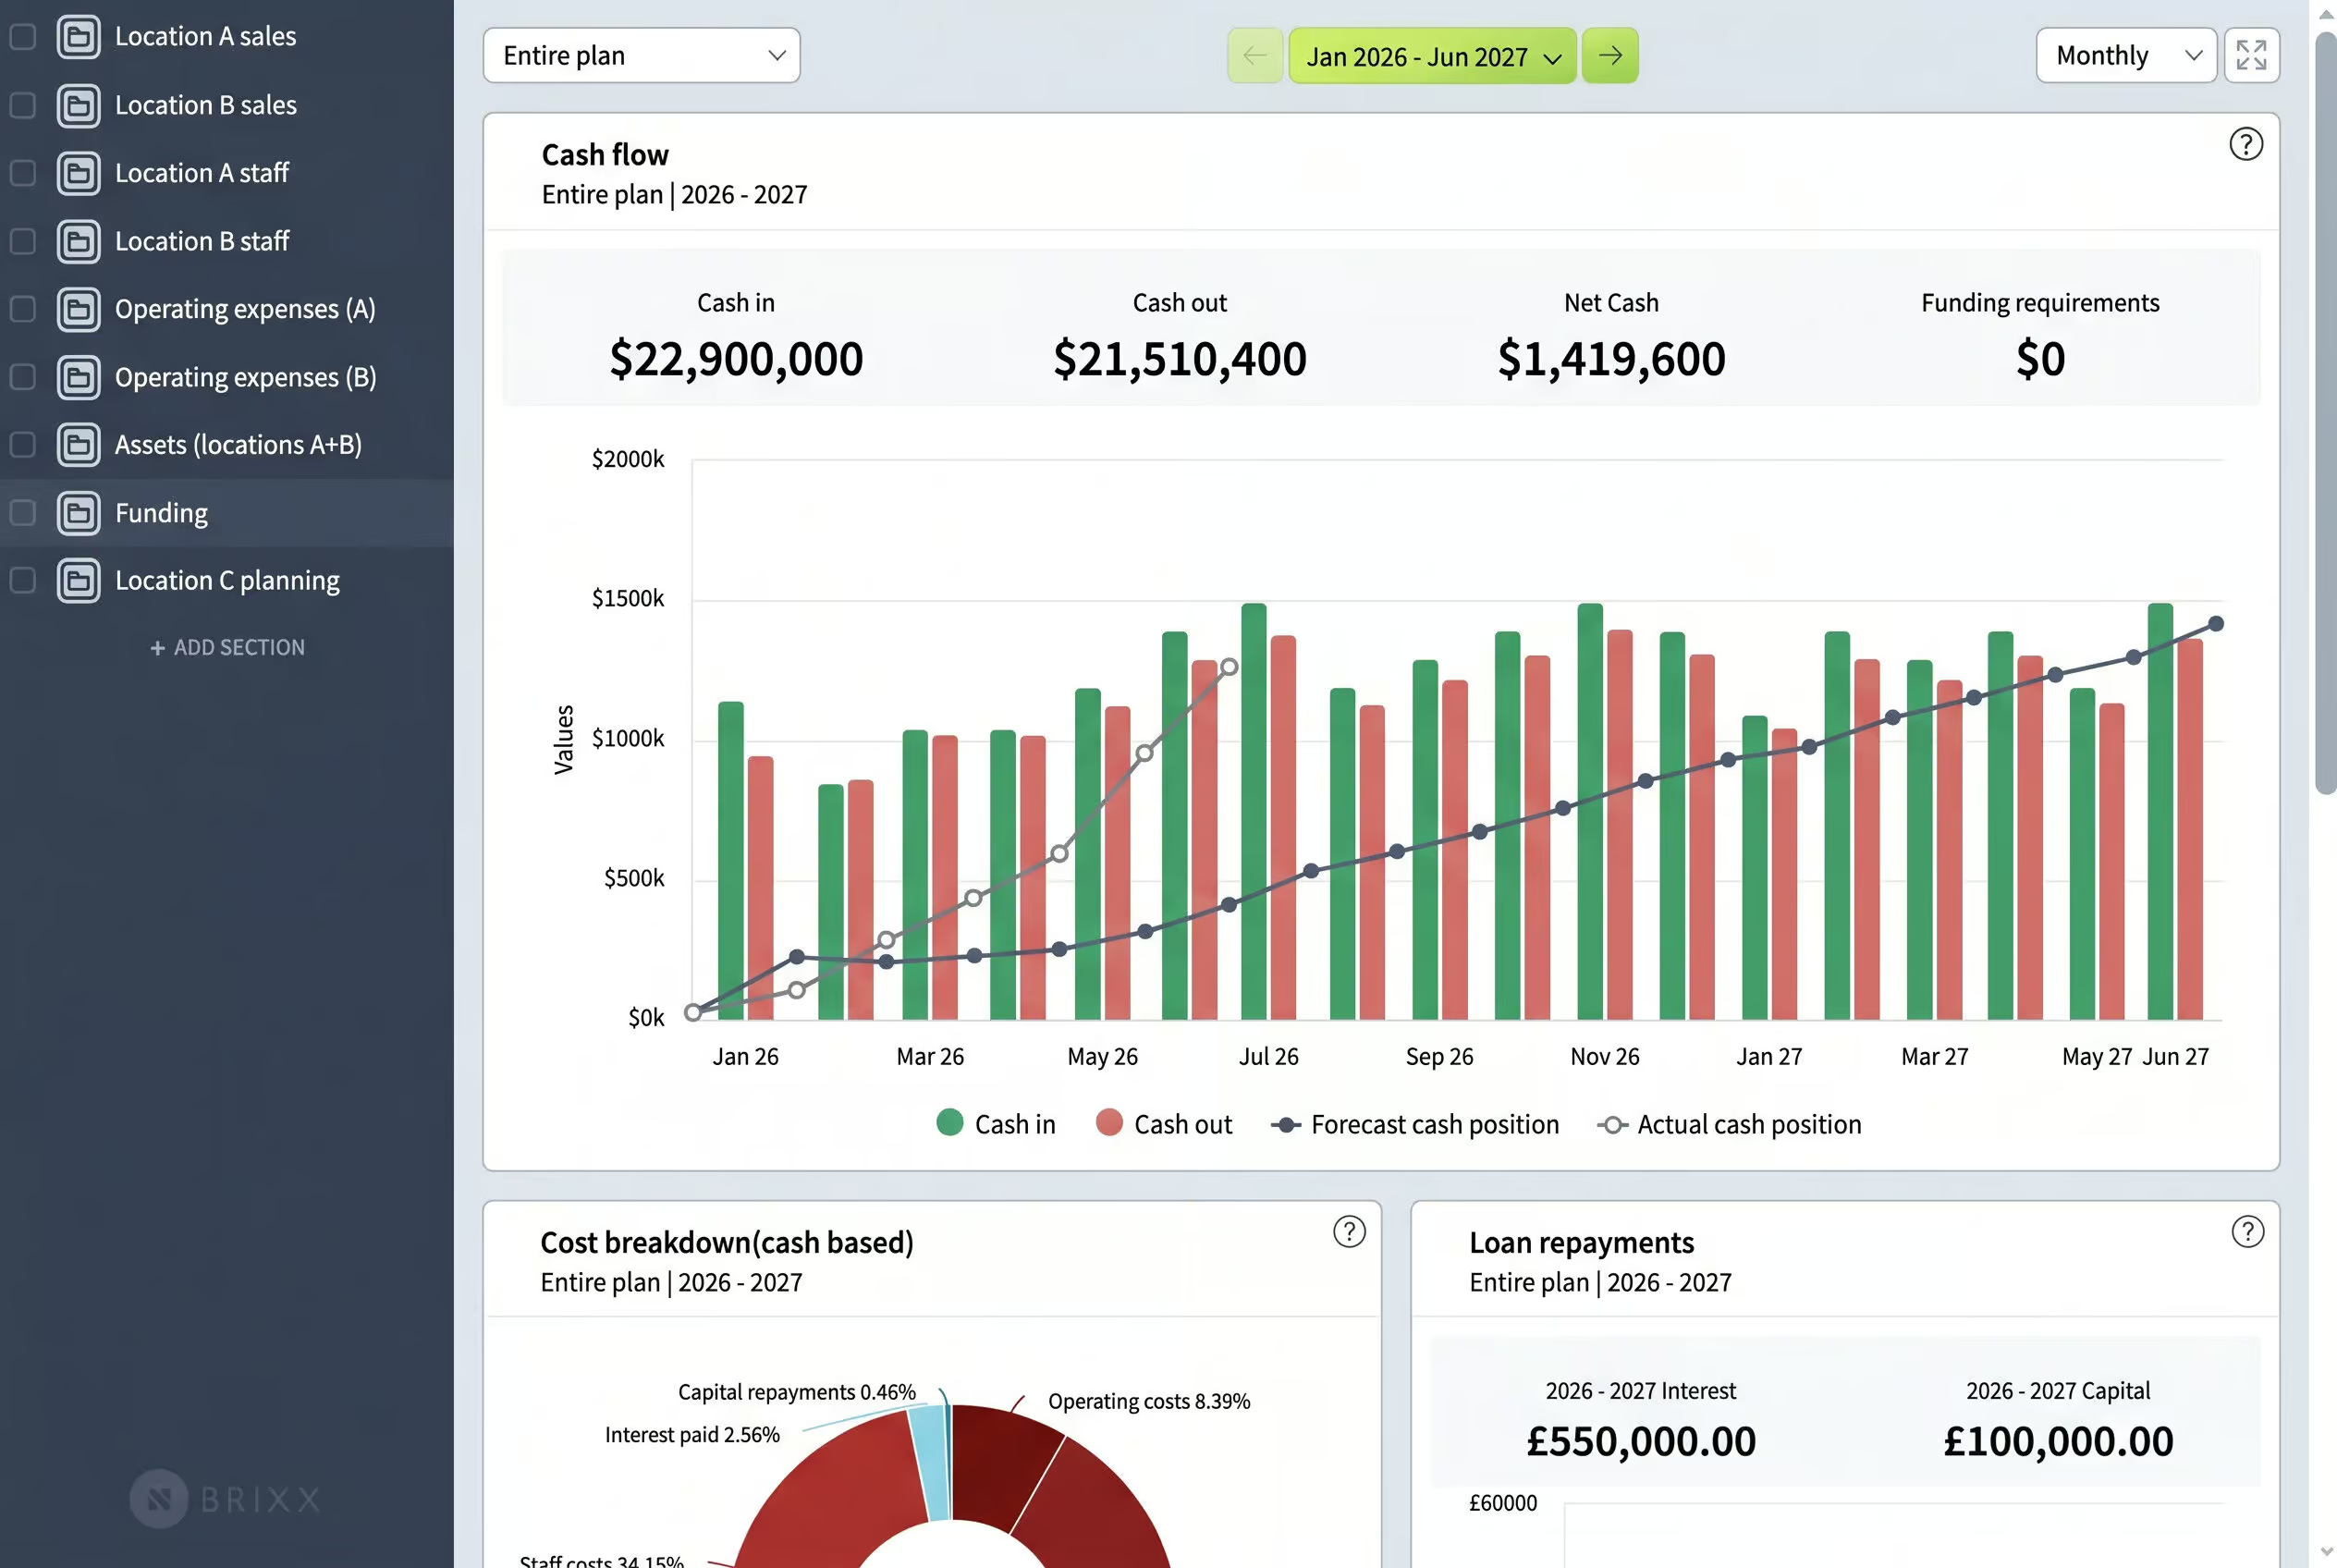
Free for 7 days. No credit card required.
Answer real questions about your business:

Any questions? We’re always here to help
It’s estimating how much cash comes in and goes out over time—usually monthly—so you can plan ahead.
Because profit doesn’t pay bills—cash does. Forecasting shows whether you’ll have enough money when payments are due.
List expected income and expenses by month, then track your cash position over time. Tools like Brixx calculate it automatically
Financial reports show how your business is performing. They include documents like your income statement, balance sheet, and cash flow statement, giving a clear picture of revenue, expenses, profit, and more.
They help you track performance, spot issues early, and make better decisions. Financial reports highlight key metrics, so you can manage cash flow and communicate clearly with investors or your accountant.
Start with the 3 core reports:
Together, they give you a complete view of your finances.
Financial reporting software helps you create reports like income statements, balance sheets, and cash flow forecasts automatically. It saves time and gives you a clear picture of your business finances without using spreadsheets.
Brixx lets you generate income statements, balance sheets, cash flow reports, tax reports, and custom charts, all automatically based on your financial plan.
Yes, you can export all reports and charts to Excel or PDF. They’re ready to share with your team, accountant, or investors.
Unlike Excel, Brixx is built for financial forecasting and reporting, no formulas or manual updates needed. Changes in your plan automatically update your reports.
Yes, Brixx includes tools for forecasting and tracking tax obligations. You can generate tax reports and plan ahead with full visibility into your liabilities.
Brixx is ideal for startups, small businesses, accountants, and anyone who wants to create accurate financial reports and forecasts without complex spreadsheets.

Each time we look for new funding, we produce a Brixx cash flow

With Brixx I can see clearly what the financial future looks like

We've seen remarkably accurate forecasting for 2 years

The value for money delivered by Brixx is unbeatable

Brixx will help us decide when our company has reached its ideal size

Brixx was enormously helpful in gaining investment
Brixx is much more efficient for my clients than spreadsheets

Brixx is a fab product

Brixx has made me feel like I've got a handle on individual projects
The client feels more in control than ever before