Present Value Table: PV Factors from 1% to 20% (with Examples)

All articles
A present value table lists discount factors that show what £1 received in the future is worth today, at a given interest rate. To use it, find the factor where your interest rate and number of periods meet, then multiply it by the future amount.
For example, £10,000 due in five years at a 5% discount rate is worth £10,000 × 0.7835 = £7,835 today.
The full tables for 1% to 20% over 1 to 20 years are below, followed by a present value of an annuity table, the formula behind them and two worked examples.

Track your finances with Brixx
Get started with our forecasting software so that you can plan your business' future
Start your free trial todayPresent value table: 1% to 10%
| Periods (n) | 1% | 2% | 3% | 4% | 5% | 6% | 7% | 8% | 9% | 10% |
|---|---|---|---|---|---|---|---|---|---|---|
| 1 | 0.9901 | 0.9804 | 0.9709 | 0.9615 | 0.9524 | 0.9434 | 0.9346 | 0.9259 | 0.9174 | 0.9091 |
| 2 | 0.9803 | 0.9612 | 0.9426 | 0.9246 | 0.9070 | 0.8900 | 0.8734 | 0.8573 | 0.8417 | 0.8264 |
| 3 | 0.9706 | 0.9423 | 0.9151 | 0.8890 | 0.8638 | 0.8396 | 0.8163 | 0.7938 | 0.7722 | 0.7513 |
| 4 | 0.9610 | 0.9238 | 0.8885 | 0.8548 | 0.8227 | 0.7921 | 0.7629 | 0.7350 | 0.7084 | 0.6830 |
| 5 | 0.9515 | 0.9057 | 0.8626 | 0.8219 | 0.7835 | 0.7473 | 0.7130 | 0.6806 | 0.6499 | 0.6209 |
| 6 | 0.9420 | 0.8880 | 0.8375 | 0.7903 | 0.7462 | 0.7050 | 0.6663 | 0.6302 | 0.5963 | 0.5645 |
| 7 | 0.9327 | 0.8706 | 0.8131 | 0.7599 | 0.7107 | 0.6651 | 0.6227 | 0.5835 | 0.5470 | 0.5132 |
| 8 | 0.9235 | 0.8535 | 0.7894 | 0.7307 | 0.6768 | 0.6274 | 0.5820 | 0.5403 | 0.5019 | 0.4665 |
| 9 | 0.9143 | 0.8368 | 0.7664 | 0.7026 | 0.6446 | 0.5919 | 0.5439 | 0.5002 | 0.4604 | 0.4241 |
| 10 | 0.9053 | 0.8203 | 0.7441 | 0.6756 | 0.6139 | 0.5584 | 0.5083 | 0.4632 | 0.4224 | 0.3855 |
| 11 | 0.8963 | 0.8043 | 0.7224 | 0.6496 | 0.5847 | 0.5268 | 0.4751 | 0.4289 | 0.3875 | 0.3505 |
| 12 | 0.8874 | 0.7885 | 0.7014 | 0.6246 | 0.5568 | 0.4970 | 0.4440 | 0.3971 | 0.3555 | 0.3186 |
| 13 | 0.8787 | 0.7730 | 0.6810 | 0.6006 | 0.5303 | 0.4688 | 0.4150 | 0.3677 | 0.3262 | 0.2897 |
| 14 | 0.8700 | 0.7579 | 0.6611 | 0.5775 | 0.5051 | 0.4423 | 0.3878 | 0.3405 | 0.2992 | 0.2633 |
| 15 | 0.8613 | 0.7430 | 0.6419 | 0.5553 | 0.4810 | 0.4173 | 0.3624 | 0.3152 | 0.2745 | 0.2394 |
| 16 | 0.8528 | 0.7284 | 0.6232 | 0.5339 | 0.4581 | 0.3936 | 0.3387 | 0.2919 | 0.2519 | 0.2176 |
| 17 | 0.8444 | 0.7142 | 0.6050 | 0.5134 | 0.4363 | 0.3714 | 0.3166 | 0.2703 | 0.2311 | 0.1978 |
| 18 | 0.8360 | 0.7002 | 0.5874 | 0.4936 | 0.4155 | 0.3503 | 0.2959 | 0.2502 | 0.2120 | 0.1799 |
| 19 | 0.8277 | 0.6864 | 0.5703 | 0.4746 | 0.3957 | 0.3305 | 0.2765 | 0.2317 | 0.1945 | 0.1635 |
| 20 | 0.8195 | 0.6730 | 0.5537 | 0.4564 | 0.3769 | 0.3118 | 0.2584 | 0.2145 | 0.1784 | 0.1486 |
Present value table: 11% to 20%
| Periods (n) | 11% | 12% | 13% | 14% | 15% | 16% | 17% | 18% | 19% | 20% |
|---|---|---|---|---|---|---|---|---|---|---|
| 1 | 0.9009 | 0.8929 | 0.8850 | 0.8772 | 0.8696 | 0.8621 | 0.8547 | 0.8475 | 0.8403 | 0.8333 |
| 2 | 0.8116 | 0.7972 | 0.7831 | 0.7695 | 0.7561 | 0.7432 | 0.7305 | 0.7182 | 0.7062 | 0.6944 |
| 3 | 0.7312 | 0.7118 | 0.6931 | 0.6750 | 0.6575 | 0.6407 | 0.6244 | 0.6086 | 0.5934 | 0.5787 |
| 4 | 0.6587 | 0.6355 | 0.6133 | 0.5921 | 0.5718 | 0.5523 | 0.5337 | 0.5158 | 0.4987 | 0.4823 |
| 5 | 0.5935 | 0.5674 | 0.5428 | 0.5194 | 0.4972 | 0.4761 | 0.4561 | 0.4371 | 0.4190 | 0.4019 |
| 6 | 0.5346 | 0.5066 | 0.4803 | 0.4556 | 0.4323 | 0.4104 | 0.3898 | 0.3704 | 0.3521 | 0.3349 |
| 7 | 0.4817 | 0.4523 | 0.4251 | 0.3996 | 0.3759 | 0.3538 | 0.3332 | 0.3139 | 0.2959 | 0.2791 |
| 8 | 0.4339 | 0.4039 | 0.3762 | 0.3506 | 0.3269 | 0.3050 | 0.2848 | 0.2660 | 0.2487 | 0.2326 |
| 9 | 0.3909 | 0.3606 | 0.3329 | 0.3075 | 0.2843 | 0.2630 | 0.2434 | 0.2255 | 0.2090 | 0.1938 |
| 10 | 0.3522 | 0.3220 | 0.2946 | 0.2697 | 0.2472 | 0.2267 | 0.2080 | 0.1911 | 0.1756 | 0.1615 |
| 11 | 0.3173 | 0.2875 | 0.2607 | 0.2366 | 0.2149 | 0.1954 | 0.1778 | 0.1619 | 0.1476 | 0.1346 |
| 12 | 0.2858 | 0.2567 | 0.2307 | 0.2076 | 0.1869 | 0.1685 | 0.1520 | 0.1372 | 0.1240 | 0.1122 |
| 13 | 0.2575 | 0.2292 | 0.2042 | 0.1821 | 0.1625 | 0.1452 | 0.1299 | 0.1163 | 0.1042 | 0.0935 |
| 14 | 0.2320 | 0.2046 | 0.1807 | 0.1597 | 0.1413 | 0.1252 | 0.1110 | 0.0985 | 0.0876 | 0.0779 |
| 15 | 0.2090 | 0.1827 | 0.1599 | 0.1401 | 0.1229 | 0.1079 | 0.0949 | 0.0835 | 0.0736 | 0.0649 |
| 16 | 0.1883 | 0.1631 | 0.1415 | 0.1229 | 0.1069 | 0.0930 | 0.0811 | 0.0708 | 0.0618 | 0.0541 |
| 17 | 0.1696 | 0.1456 | 0.1252 | 0.1078 | 0.0929 | 0.0802 | 0.0693 | 0.0600 | 0.0520 | 0.0451 |
| 18 | 0.1528 | 0.1300 | 0.1108 | 0.0946 | 0.0808 | 0.0691 | 0.0592 | 0.0508 | 0.0437 | 0.0376 |
| 19 | 0.1377 | 0.1161 | 0.0981 | 0.0829 | 0.0703 | 0.0596 | 0.0506 | 0.0431 | 0.0367 | 0.0313 |
| 20 | 0.1240 | 0.1037 | 0.0868 | 0.0728 | 0.0611 | 0.0514 | 0.0433 | 0.0365 | 0.0308 | 0.0261 |
How to read a present value table
- Pick your discount rate. This is the return you could earn elsewhere, your cost of borrowing, or the minimum return you need.
- Count the periods until the money arrives. The tables above assume annual periods and payment at the end of each period.
- Find the factor where the rate column and period row meet.
- Multiply the factor by the future amount to get its present value.
Every factor is below 1 because money in the future is worth less than money today. The higher the rate and the longer the wait, the smaller the factor. At 12% over 10 years, £1 is worth just £0.3220 today.
The present value formula
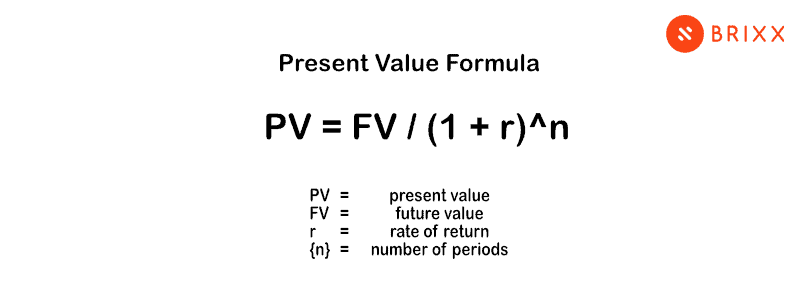
Each factor in the table comes from this formula:
PV = FV ÷ (1 + r)ⁿ
- PV is the present value.
- FV is the future value, the amount you will receive or pay.
- r is the discount rate per period, as a decimal (5% = 0.05).
- n is the number of periods until the money arrives.
The table simply works out 1 ÷ (1 + r)ⁿ for you. For 5% over five years: 1 ÷ 1.05⁵ = 1 ÷ 1.2763 = 0.7835.
Worked example 1: what is a future payment worth today?
A customer offers to settle a £10,000 debt in five years’ time instead of today. If you could earn 5% a year on the money elsewhere, what is that offer really worth?
- Find the factor for 5% and 5 periods: 0.7835.
- Multiply: £10,000 × 0.7835 = £7,835.
Waiting five years for £10,000 is equivalent to accepting £7,835 today. Any offer of more than £7,835 now would be the better deal.
Worked example 2: is an investment worth it?
A bakery is considering a new oven that costs £20,000 today and is expected to save £6,000 a year for four years. Its cost of borrowing is 8%.
| Year | Saving | 8% factor | Present value |
|---|---|---|---|
| 1 | £6,000 | 0.9259 | £5,555.40 |
| 2 | £6,000 | 0.8573 | £5,143.80 |
| 3 | £6,000 | 0.7938 | £4,762.80 |
| 4 | £6,000 | 0.7350 | £4,410.00 |
| Total present value of savings | £19,872.00 | ||
| Less cost of the oven | £20,000.00 | ||
| Net present value | −£128.00 | ||
Although the oven saves £24,000 in total, those savings are worth £19,872 in today’s money, slightly less than it costs. At an 8% cost of borrowing, the investment does not quite pay for itself. If the bakery could borrow more cheaply, or the savings lasted a fifth year, the answer would change. This is the basis of discounted cash flow analysis and the capital budgeting process.
Present value of an annuity table: 1% to 10%
When the same amount arrives every period, as in the bakery example, you can use an annuity table instead of adding up each year. Each factor is the sum of the present value factors for that rate up to that period.
| Periods (n) | 1% | 2% | 3% | 4% | 5% | 6% | 7% | 8% | 9% | 10% |
|---|---|---|---|---|---|---|---|---|---|---|
| 1 | 0.9901 | 0.9804 | 0.9709 | 0.9615 | 0.9524 | 0.9434 | 0.9346 | 0.9259 | 0.9174 | 0.9091 |
| 2 | 1.9704 | 1.9416 | 1.9135 | 1.8861 | 1.8594 | 1.8334 | 1.8080 | 1.7833 | 1.7591 | 1.7355 |
| 3 | 2.9410 | 2.8839 | 2.8286 | 2.7751 | 2.7232 | 2.6730 | 2.6243 | 2.5771 | 2.5313 | 2.4869 |
| 4 | 3.9020 | 3.8077 | 3.7171 | 3.6299 | 3.5460 | 3.4651 | 3.3872 | 3.3121 | 3.2397 | 3.1699 |
| 5 | 4.8534 | 4.7135 | 4.5797 | 4.4518 | 4.3295 | 4.2124 | 4.1002 | 3.9927 | 3.8897 | 3.7908 |
| 6 | 5.7955 | 5.6014 | 5.4172 | 5.2421 | 5.0757 | 4.9173 | 4.7665 | 4.6229 | 4.4859 | 4.3553 |
| 7 | 6.7282 | 6.4720 | 6.2303 | 6.0021 | 5.7864 | 5.5824 | 5.3893 | 5.2064 | 5.0330 | 4.8684 |
| 8 | 7.6517 | 7.3255 | 7.0197 | 6.7327 | 6.4632 | 6.2098 | 5.9713 | 5.7466 | 5.5348 | 5.3349 |
| 9 | 8.5660 | 8.1622 | 7.7861 | 7.4353 | 7.1078 | 6.8017 | 6.5152 | 6.2469 | 5.9952 | 5.7590 |
| 10 | 9.4713 | 8.9826 | 8.5302 | 8.1109 | 7.7217 | 7.3601 | 7.0236 | 6.7101 | 6.4177 | 6.1446 |
| 11 | 10.3676 | 9.7868 | 9.2526 | 8.7605 | 8.3064 | 7.8869 | 7.4987 | 7.1390 | 6.8052 | 6.4951 |
| 12 | 11.2551 | 10.5753 | 9.9540 | 9.3851 | 8.8633 | 8.3838 | 7.9427 | 7.5361 | 7.1607 | 6.8137 |
| 13 | 12.1337 | 11.3484 | 10.6350 | 9.9856 | 9.3936 | 8.8527 | 8.3577 | 7.9038 | 7.4869 | 7.1034 |
| 14 | 13.0037 | 12.1062 | 11.2961 | 10.5631 | 9.8986 | 9.2950 | 8.7455 | 8.2442 | 7.7862 | 7.3667 |
| 15 | 13.8651 | 12.8493 | 11.9379 | 11.1184 | 10.3797 | 9.7122 | 9.1079 | 8.5595 | 8.0607 | 7.6061 |
For the bakery: the factor for 8% over 4 periods is 3.3121, so £6,000 × 3.3121 = £19,872.60. The 60p difference from the year-by-year method is only rounding in the four-decimal factors.
When businesses use present value tables
- Investment decisions: comparing what future returns are worth today against what an investment costs now.
- Capital budgeting: choosing between projects whose costs and returns are spread over several years.
- Loans and leases: understanding the true cost of repayments in today’s money.
- Pricing payment terms: deciding whether a customer’s offer to pay later, or an early payment discount, makes sense.
- Long-term planning: setting targets for savings, pensions or replacement of equipment.
To compare returns once they are in today’s terms, see return on investment. For a quick rule of thumb on how fast money grows, see the rule of 72.
Limitations of present value tables
- Rounding: factors are rounded to four decimal places, so large amounts can be out by a few pounds.
- Fixed periods: the tables assume whole annual periods and payment at the end of each period. Monthly payments need a monthly rate and more periods.
- A constant rate: real interest rates change over time.
A spreadsheet avoids the rounding: in Excel or Google Sheets, =1/(1+r)^n gives the exact factor and =PV(rate, periods, payment) handles annuities.
Frequently asked questions
What is a present value table?
It is a reference table of discount factors showing the present value of £1 received at the end of a given number of periods, at a range of interest rates. Multiply the factor by any future amount to find what it is worth today.
What is the present value factor for 10% over 3 years?
0.7513. So £1,000 received in three years, discounted at 10%, is worth £751.30 today.
What is the difference between a present value table and an annuity table?
A present value table values a single payment. A present value of an annuity table values a series of equal payments, one at the end of each period. The annuity factor is the running total of the single-payment factors.
Why do present value factors get smaller over time?
Because money received later has had less time to be invested, and carries more risk. The longer you wait and the higher the rate, the less a future payment is worth today.
How do I calculate present value without a table?
Use the formula PV = FV ÷ (1 + r)ⁿ, or the PV function in a spreadsheet. The table is just a shortcut that saves you working out 1 ÷ (1 + r)ⁿ each time.
Take the maths out of forecasting
Present value tables are useful for one-off decisions. For planning the whole business, Brixx works out the numbers for you, from cash flow forecasts to financial reports, so you can test investments and funding options against your full plan. See how financial planning and analysis works in Brixx.