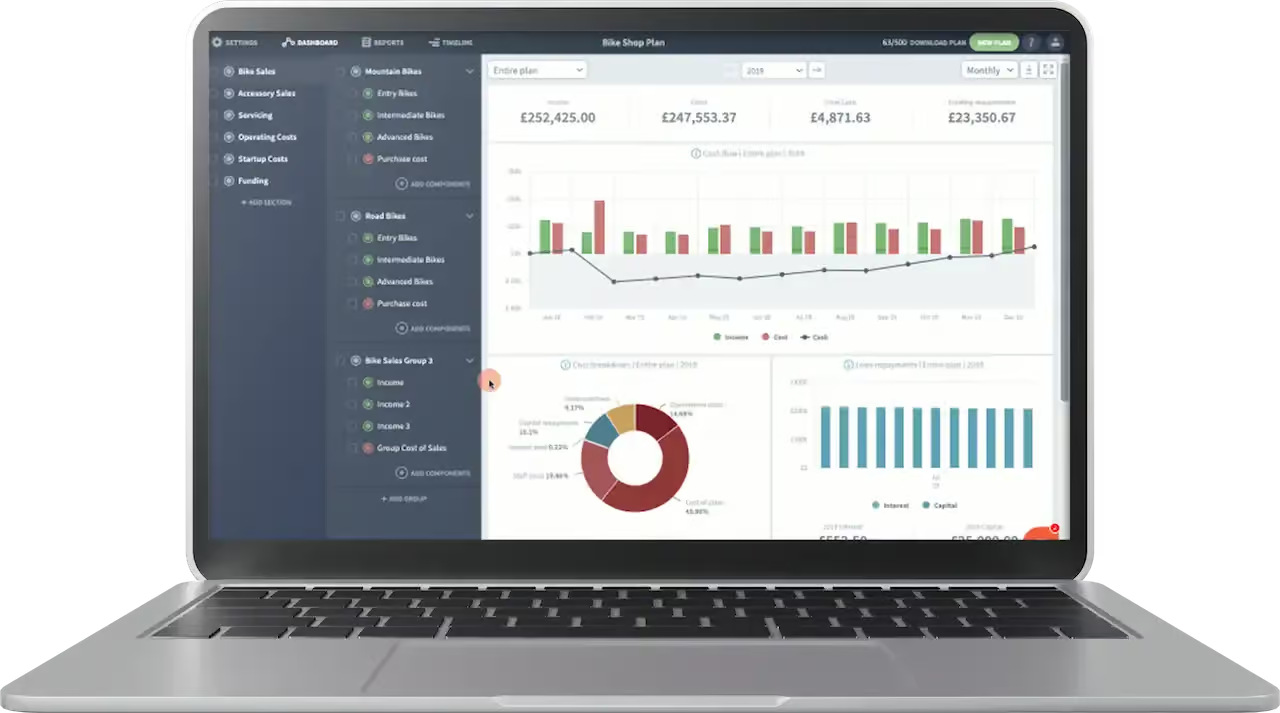
Financial Modelling Tool for Hotel Owners
As a hotel owner, understanding how your cash flow may fluctuate throughout the year and knowing when to make strategic decisions is essential. Brixx offers the financial tools you need to gain timely and crucial insights to guide your hotel operations and growth.
Start for free
Who can use this Brixx template?
Hospitality managers
Boutique and independent hotel operators
Start using this template
Not listed? View all our templates
What are the benefits to hotel owners?
Hotel Template
This template is tailored to the hospitality industry, covering all aspects of hotel operations and financial planning
Cash Flow Modelling
Effortlessly model business cash flow, room revenue, operational costs, and financing expenses
Charts & Graphs
Easily interpret results and graphs to assess the profitability of various pricing and occupancy strategies
Impact Analysis
Quickly evaluate the impact of new income streams, such as event hosting, restaurant services, or spa treatments
Scenario Testing
Receive immediate feedback when testing different scenarios like seasonal pricing changes, renovations, or shifts in customer demand
Get started with the best financial projection software – today!
Financial modelling software is essential for hotel owners, providing the insights needed to plan and manage hospitality businesses effectively. By forecasting costs, hotel operators can gain a clearer picture of their financial landscape. Additionally, predicting room occupancy rates, seasonal revenue fluctuations, and operational expenses enables informed decisions on pricing strategies, staffing, and resource allocation.
The ability to identify market trends, adjust room rates, and plan for fluctuations in demand further strengthens a hotel's long-term success. With over 20 years of business modelling experience, Brixx stands out as a trusted solution, offering a robust set of features to help hotel owners confidently navigate the complexities of financial planning.
Start for free
Model your hotel business in Brixx – see how quickly your finances can make sense!
Project Setup
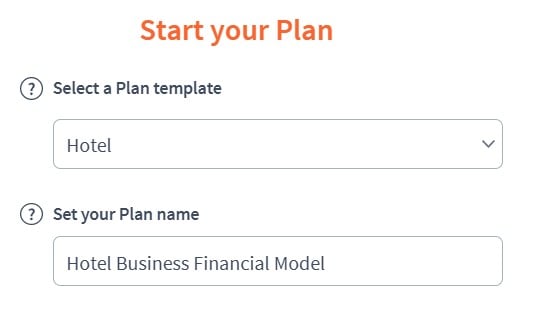
- Project Name : Hotel Business Financial Model
- Time Period : Monthly (ideal for tracking revenue, operational expenses, and occupancy rates)
Setup 
Income Components
Component: Room Revenue
Sub-components:
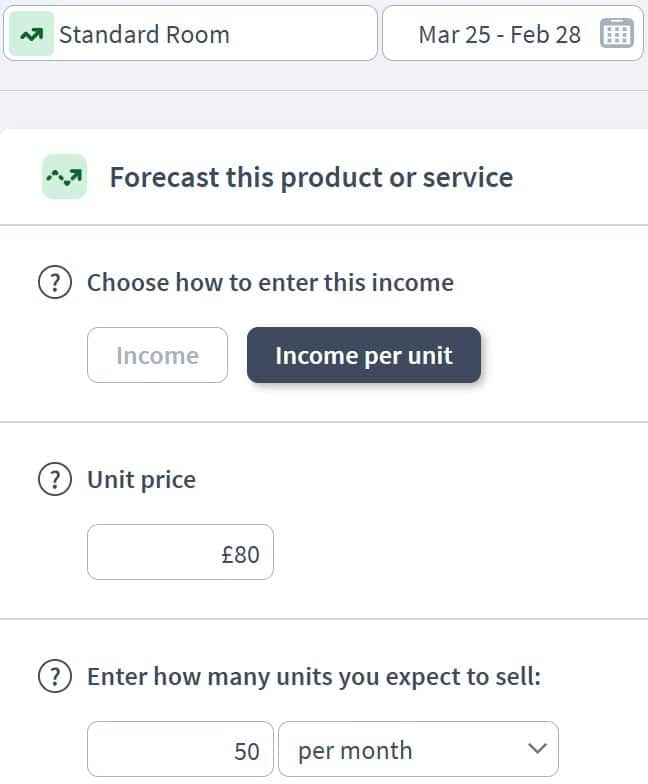
- Standard Room Revenue – (£80/night, 50 rooms, 70% occupancy) = £84,000/month
- Suite Revenue – (£200/night, 10 rooms, 60% occupancy) = £36,000/month
- Conference Room Hire – (£500/day, 10 bookings/month) = £5,000/month
Component: Additional Income
Sub-components:
- Restaurant & Bar Sales – (£25 per guest, 50% of guests dine in) = £50,000/month
- Spa & Wellness Services – (£60 per session, 300 sessions/month) = £18,000/month
- Event Hosting (Weddings, Corporate Events) – (£3,000 per event, 4 events/month) = £12,000/month
- Parking Fees – (£10/day per car, 20 cars/day) = £6,000/month
- Late Check-Out Fees – (£30 per late check-out, 50 bookings/month) = £1,500/month
Income 
Expenditure Components
Component: Operational Costs
Sub-components:
- Mortgage or Rent – (£20,000/month)
- Staff Salaries – (£60,000/month for reception, housekeeping, kitchen, management)
- Utilities (Water, Electricity, Gas, Internet) – (£8,000/month)
- Cleaning & Maintenance – (£5,000/month)
- Hotel Management Software – (£300/month)
- Insurance (Building, Liability, Employee Insurance) – (£2,500/month)
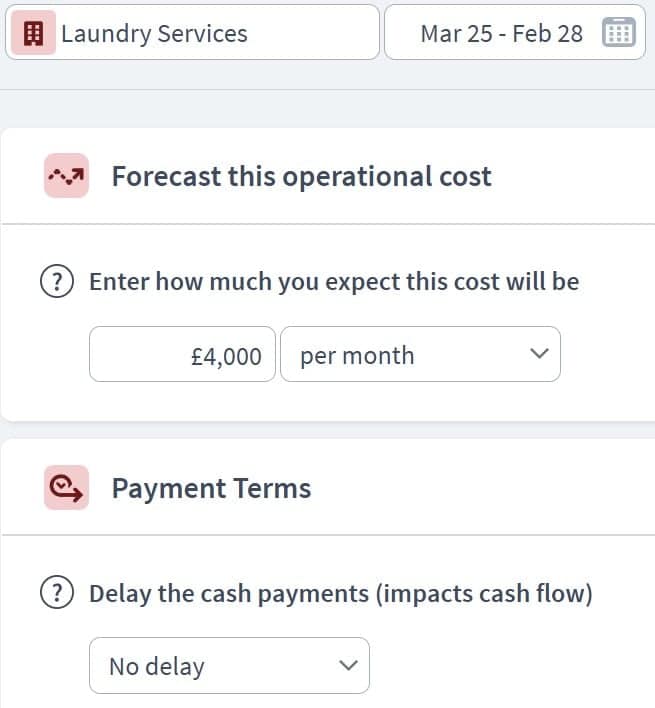
- Laundry Services – (£4,000/month)
Component: Administrative Costs
Sub-components:
- Marketing & Advertising – (£5,000/month for online ads, partnerships)
- Legal & Accounting Fees – (£1,500/month)
- Licensing & Permits – (£2,000/year, allocated as £166/month)
Expenditure 
Asset Components
Component: Fixed Assets
Sub-components:
- Hotel Property – (£3,000,000, appreciating at 2% annually)
- Furniture & Fixtures – (£250,000, depreciated over 10 years)
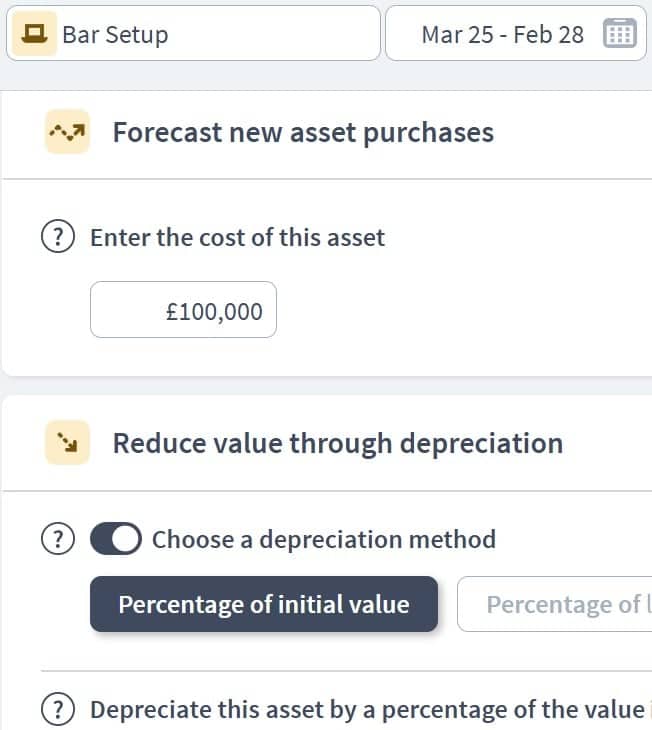
- Kitchen Equipment & Bar Setup – (£100,000, depreciated over 5 years)
- Spa & Wellness Equipment – (£50,000, depreciated over 7 years)
Component: Current Assets
Sub-components:
- Cash Reserves – (Starting balance + monthly surplus)
- Accounts Receivable (Outstanding payments from event bookings, corporate clients) – (Variable)
- Inventory (Food & Beverage Stock, Toiletries, Linens) – (£10,000 at any given time)
Assets 
Funding Components
Component: Loans and Financing
Sub-components:
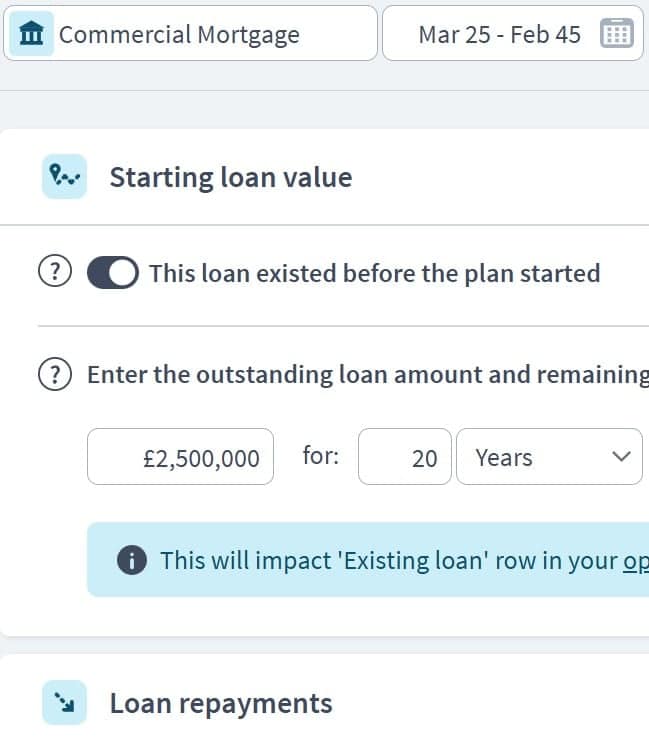
- Commercial Mortgage – (£2,500,000 at 5% interest, 20-year term)
- Business Loan for Renovation – (£200,000 at 6% interest, 5-year term)
Component: Personal Investment
Sub-components:
- Initial Owner Investment – (£500,000)
- Investor Contributions – (£300,000 from private investors)
Component: Future Funding (Optional)
Sub-components:
- Bridging Loan for Expansion – (£250,000, short-term high-interest loan)
Funding 
Scenario Planning in Brixx
Occupancy Rate Scenarios
- Model 50%, 70%, or 90% occupancy to see the impact on revenue.
Seasonal Variations
- Adjust room rates for peak seasons (e.g., summer, holidays) and low seasons.
Cost Increases
- Test scenarios where wages, utility costs, or food expenses increase by 10%.
Expansion Planning
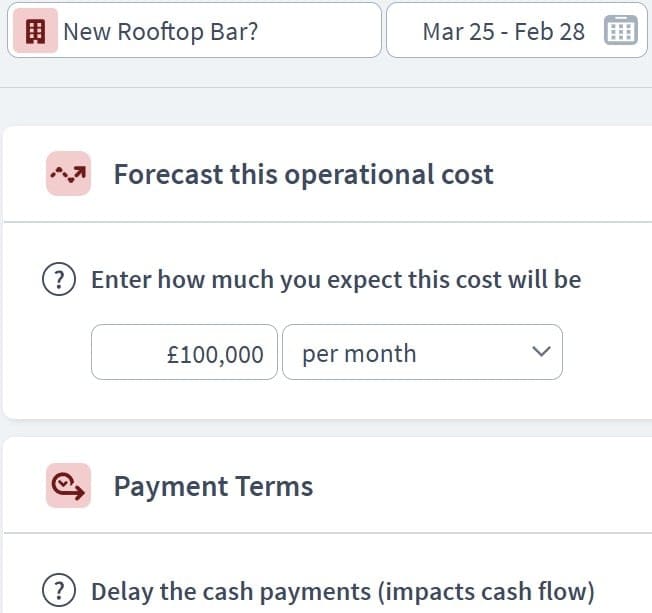
- Model a scenario where additional rooms or amenities (e.g., a rooftop bar) are added.
Scenarios 
Dashboard & Reporting
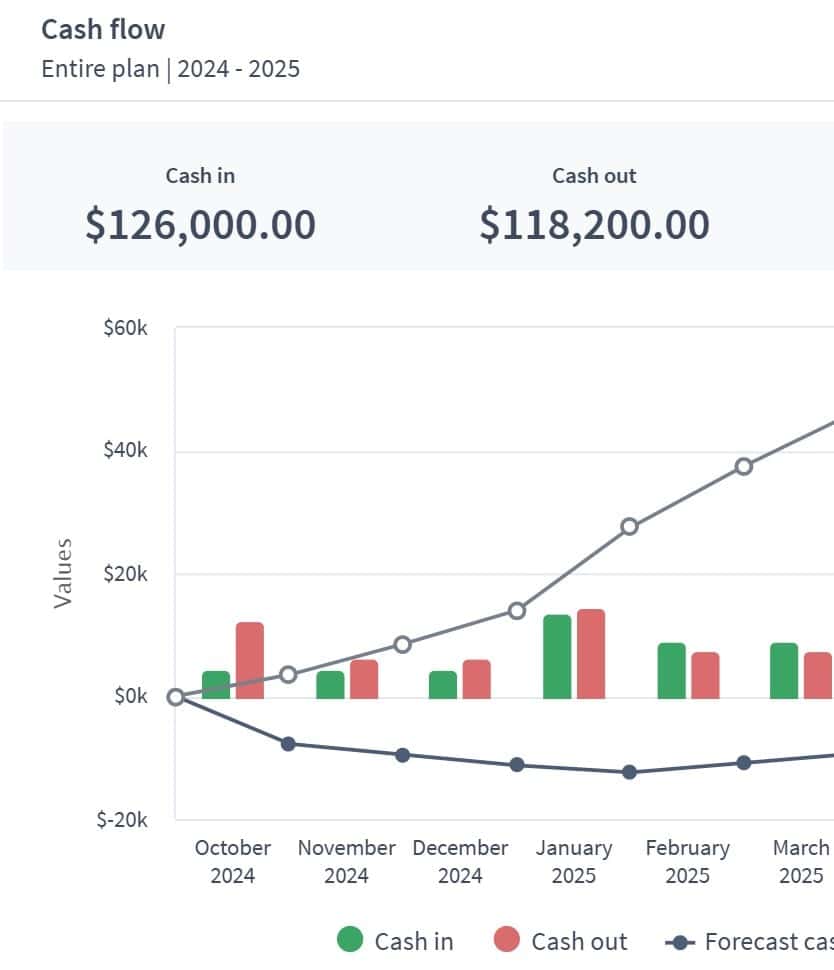
Cash Flow Report
- Visualise monthly revenue vs. expenses, highlighting net profit.
Balance Sheet
- Track growing asset values while seeing liabilities reduce over time.
Profit & Loss Statement
- Display total revenue, operational costs, and net profit per fiscal year.
Custom KPIs
- Average Revenue Per Room (ARR): Total room revenue ÷ rooms sold.
- Occupancy Rate: (Occupied rooms ÷ available rooms) × 100.
- Gross Operating Profit Per Available Room (GOPPAR): (Total revenue – operational expenses) ÷ total available rooms.
Dashboard 
Strategic forecasting in Brixx
Calculating the profitability impact of varying room rates and occupancy levels
Demonstrating projected earnings to support business loans and investment decisions
Forecasting and budgeting for hotel maintenance, renovations, and staff salaries
Anticipating financial requirements for marketing campaigns, expansions, or new service offerings
Evaluating the impact of market trends on bookings, operating costs, and revenue streams
Explore different industry frameworks you can build in Brixx for your business

Private Healthcare Firm
As a private healthcare business, managing cash flow fluctuations and making strategic financial decisions is crucial.
Travel Agency
Running a travel agency means managing seasonal income, fluctuating demand, and various booking and operating costs.
Aviation Business
For aviation businesses and aircraft leasing companies, managing seasonal fluctuations, capital-intensive assets, and complex financing arrangements is no small task.

Restaurant
Restaurant owners face seasonal cash flow dynamics and challenging decision points throughout the year.




Start using Brixx for free
Free for 7 days. No credit card required.
Answer real questions about your business:
- Scenario testing
- 10-year financial forecast
- Pre-built templates
- Xero integration
- Automated reports: P&L, balance sheet, cash flow, tax & more