Financial Modelling Tool for Mobile App Startups
Launching and scaling a mobile app business means staying on top of fluctuating user growth, development costs, and evolving strategies. Brixx gives app founders and startup teams the financial modelling tools they need to forecast revenue and guide smart business decisions – from day one!
Start for free
Who can use this Brixx template?
Indie app developers
SaaS founders and product teams
Start using this template
Not listed? View all our templates
What are the benefits to mobile app startups?
Mobile App Template
Purpose-built for digital business modelling – track user growth, recurring revenue, and churn rates
Revenue Forecasting
Forecast one-time purchases, ad income, or in-app subscriptions with ease
Live Dashboards
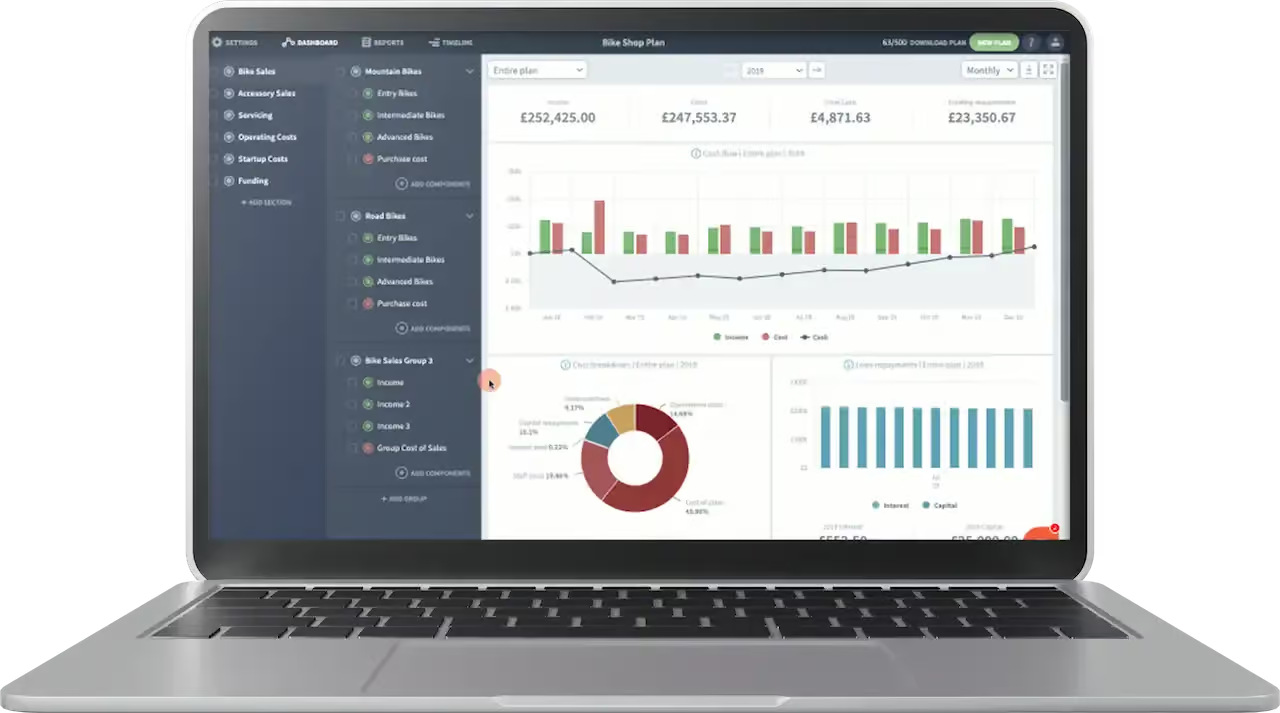
Visualise your financial performance with clear, interactive charts and dashboards
Scenario Planning
Quickly simulate changes in pricing, user acquisition, or feature releases to test potential outcomes
Funding & Capital
Plan for new funding rounds, team expansion, and infrastructure scaling
Get started with the best financial projection software – today!
In the fast-moving world of tech startups, having a clear view of your cash flow is critical. Brixx's financial forecasting software equips mobile app entrepreneurs with the insights needed to navigate growth challenges, investor conversations, and product development decisions.
With decades of experience in business modelling and planning, Brixx helps you explore different paths your app can take – so you can scale with confidence, attract investment, and build a sustainable future.
Start for freeModel your mobile app startups business in Brixx – see how quickly your finances can make sense!
Project Setup
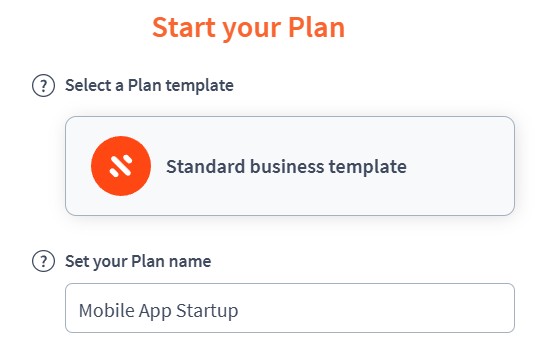
- Project name : Mobile App Startup
- Time period : Monthly (ideal for tracking subscription revenue, marketing spend, development cycles)
Setup 
Income Components
Component: Core Revenue
Sub-components:
- Freemium Conversions – Monthly Subscriptions (£5/user × 2,000 users = £10,000/month)
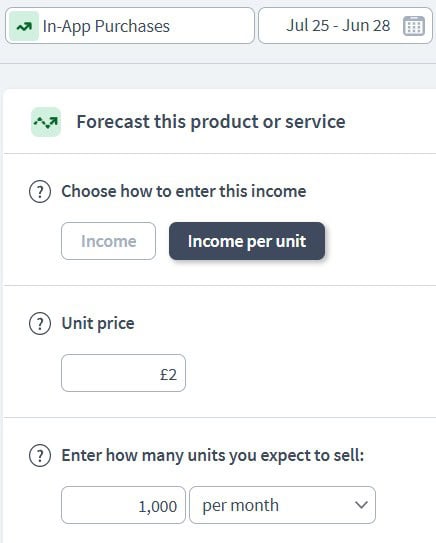
- In-App Purchases (Avg £2/user × 1,000 = £2,000/month)
- Ads Revenue (CPM model – £5 per 1,000 impressions × 100,000 = £500/month)
Component: Additional Revenue
Sub-components:
- B2B SaaS Licensing (£300/month per company × 5 = £1,500/month)
- Affiliate Commissions (£100/month average)
- API Access Fees (£200/month)
Income 
Expenditure Components
Component: Operating Costs
Sub-components:
- Developer Salaries (2 × £3,500/month = £7,000/month)
- UI/UX Designer (£3,000/month)
- Cloud Hosting (AWS, Firebase) (£1,200/month)
- Payment Processor Fees (3% of income ≈ £390/month)
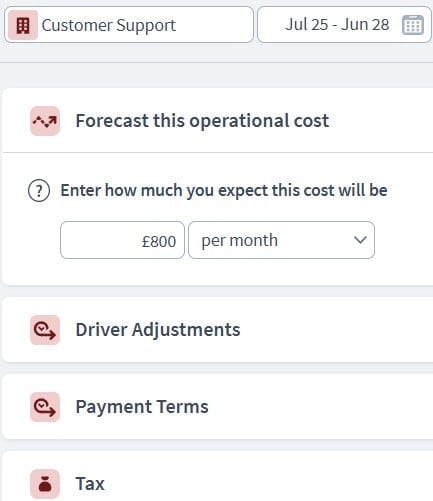
- Customer Support (£800/month)
- App Store Fees (£150/year for Apple/Google developer accounts)
Component: Marketing & Sales
Sub-components:
- Paid Ads – Google/Facebook (£2,500/month)
- Influencer Sponsorships (£1,000/month)
- Email Marketing Tools (£150/month)
- CRM Tools (£100/month)
- Affiliate Commissions (£200/month)
Expenditure 
Asset Components
Component: Fixed Assets
Sub-components:
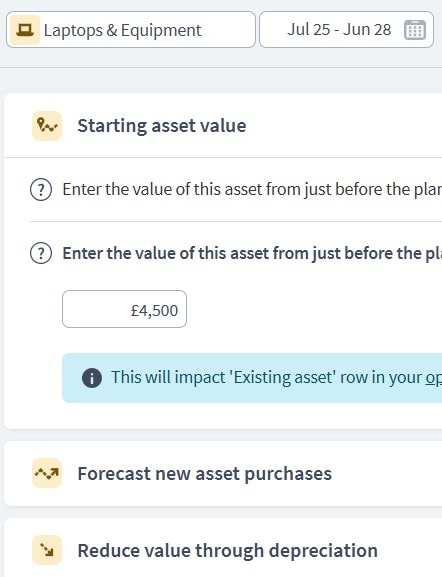
- Laptops & Equipment (3 × £1,500 = £4,500, depreciated over 3 years)
- Purchased Code Libraries/Assets (£2,000, depreciated over 2 years)
Component: Intangible Assets
Sub-components:
- App Development IP (Total £40,000 over 6 months, depreciated over 5 years)
- Brand Value (Optional: modelled as goodwill during acquisition/funding)
Component: Current Assets
Sub-components:
- Cash Reserves (Starting balance: £50,000 from initial funding)
- Accounts Receivable (~£3,000 from B2B licensing)
- Prepaid Subscriptions (e.g., cloud hosting prepaid – £1,200/year)
Assets 
Funding Components
Component: Equity Investment
Sub-components:
- Angel Investment (£100,000 in Month 1)
- Founders' Capital (£10,000 startup cash)
Component: Grants or Loans
Sub-components:
- Government Startup Grant (£15,000 in Month 2)
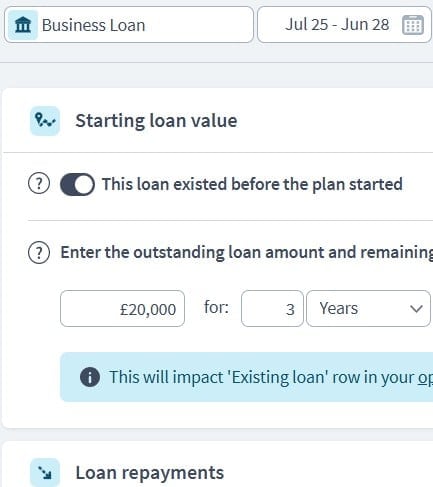
- Business Loan (£20,000 at 6% interest, 3-year term)
Funding 
Scenario Planning in Brixx
Churn Rate Scenarios
- Model user churn at 2%, 5%, and 10% monthly to test impact on MRR and LTV.
User Growth Assumptions
- Test viral vs. linear growth – e.g., 5% MoM vs. 20% referral-based acceleration.
Ad Spend Efficiency
- Compare ROI with higher or lower ad spend, adjusting CAC and user acquisition.
Revenue Share Changes
- Test app store policy updates – e.g., 30% vs. 15% revenue share.
Unexpected Downtime
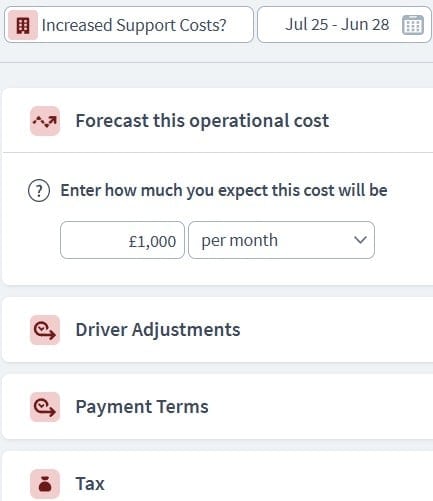
- Add one-off event with £0 revenue for a week + increased support costs.
Scenarios Dashboard & Reporting
Cash Flow Report
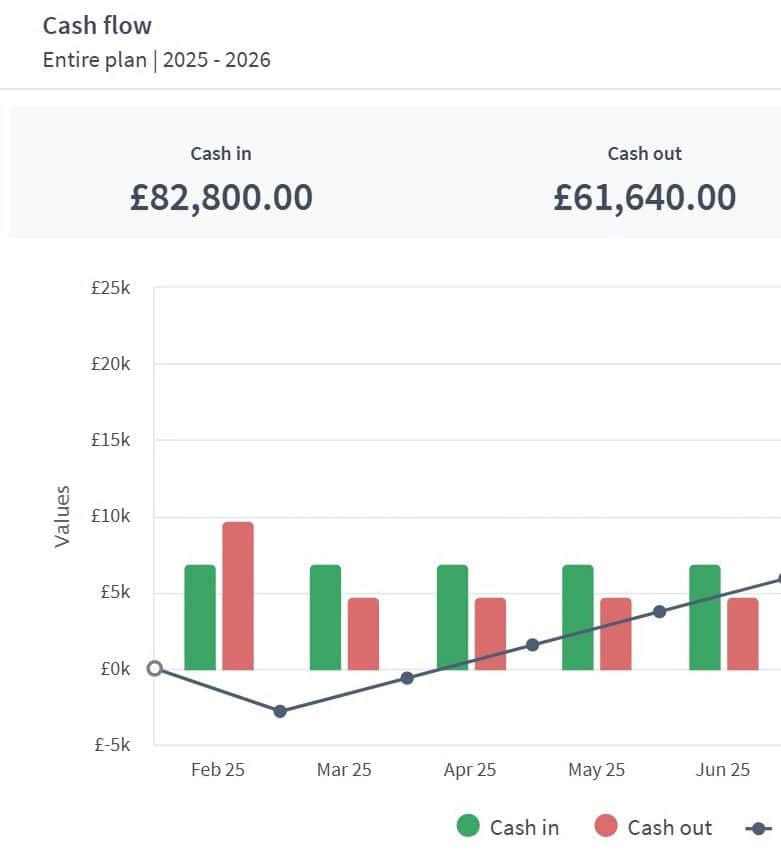
- Visualise monthly income vs. costs, highlighting burn rate and runway.
Balance Sheet
- Show value of app IP, fixed assets, and liabilities (e.g., loans).
Profit & Loss Statement
- Track subscription income, marketing spend, and EBITDA.
Custom KPIs
- Set up metrics such as Monthly Recurring Revenue (MRR), CAC, LTV, Churn Rate, and Runway.
Dashboard 
Strategic forecasting in Brixx
Model the impact of pricing changes on MRR (Monthly Recurring Revenue)
Estimate burn rate and runway under different growth scenarios
Prepare realistic financials for seed and Series A fundraising
Plan marketing spend and acquisition costs based on expected ROI
Understand the financial implications of freemium vs. paid-only models
Explore different industry frameworks you can build in Brixx for your business

SaaS
SaaS business owners must navigate the complexities of annual cash flow fluctuations and make strategic decisions.
Tech Startup
Running a tech startup means navigating rapid growth, shifting markets, and constant innovation.
App Developer
As an app developer, knowing when to scale, invest, or pivot your business can be the difference between success and.
Digital Marketing Agency
As a digital marketing agency, understanding how your revenue streams fluctuate and knowing when to make strategic decisions is essential.




Start using Brixx for free
Free for 7 days. No credit card required.
Answer real questions about your business:
- Scenario testing
- 10-year financial forecast
- Pre-built templates
- Xero integration
- Automated reports: P&L, balance sheet, cash flow, tax & more