Your Guide to the Plan Interface
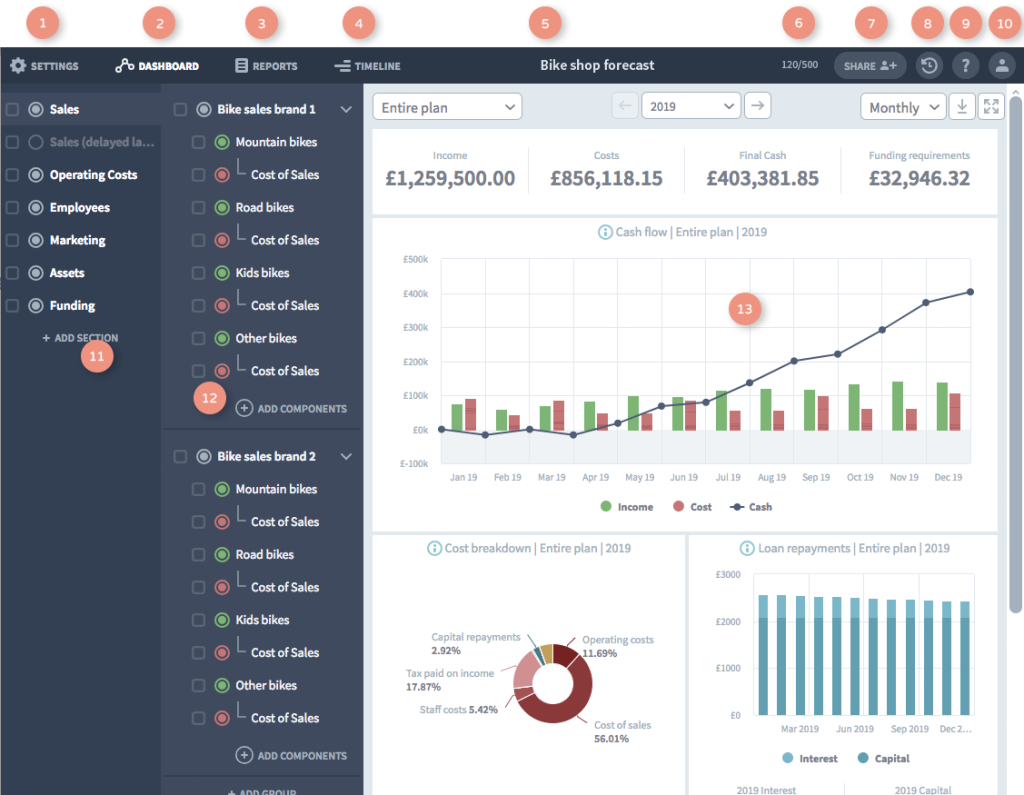
- Settings – Customise general settings, financial settings and the opening balance.
- Dashboard – The default view displaying the Brixx charts, visible in the screenshot.
- Reports – A report view, with the option of switching between the many available reports.
- Timeline – Make quick changes to the start and end dates for activities in your plan.
- Actuals – Populate your plan with actual figures, to compare with your forecast, and manage your cash flow.
- Plan name – Displayed at the top of the plan, you can change this in settings.
- Component counter – Track the number of components used in the plan.
- Sharing – Provide view or edit access to your plan to other people.
- Downloads – Export charts and reports into different file types
- Version history – See all changes to your plan and restore to earlier versions.
- Help area – Leads to the support page with guides and videos
- Account dropdown – Access other plans, go to your account area, visit the support portal, and sign out of your account.
- Section panel – Shows a list of your sections. Sections are folders that hold large parts of your plan.
- Groups panel – Shows the contents of the section you have open. It consists of groups of components.
- Right panel (currently showing dashboard) – Your dashboard, reports and timeline will appear on the right depending on which menu option you have selected. It’s also where you can edit component data.

