What is a profit and loss forecast?
A profit and loss forecast report is a way of measuring a business’ cash over a particular period of time. Specifically, it measures what is gained, what is lost, and the net gain or loss.
In accounting, financial activities have consequences – and the profit and loss represents these consequences as either a profit or a loss for the business. As one of the ‘big three’ financial reports (3-way forecasting), the role of the P&L (also called the income statement) is to show the different types of transactions the business undertakes and the gains and losses made by a business on these transactions.
Unlike the cash flow statement, which only measures when money actually changes hands, the P&L recognises transactions when they occur, rather than when cash is actually paid. Also unlike the cash flow, it shows the non-cash gains and losses to a business – for example the growth in the value of investments or losses of value incurred through wear and tear on equipment. While this means there are several non-cash transactions present on the P&L that are not shown in the cash flow forecast, there are also cash transactions do not appear on the P&L if the business has not gained or lost anything in the transaction – buying a car worth £5000 for £5000 is neither a net gain or net loss.
In practice, this can make the profit and loss forecast a confusing place to be if you’re expecting it to act like a cash flow!
Download our free profit and loss template below:
What makes up a profit and loss forecast report?
There are many ways to organise a P&L report. Using Brixx as your financial reporting tool, report lines can be drilled into to reveal the structure of the plan you have built, getting more detail into your reports without having to worry about matching financial activities up to the right accounts – the app does it for you.
The Brixx P&L can be divided into 5 sections:
- Revenue and Cost of Sales
- Operating Costs
- Finance Costs and Income
- Taxation and Profit
- Dividends and Retained Surplus
… Which in turn produce these key profit analysis lines:
- Gross profit
- Operating profit
- Profit
For the uninitiated, that seems like a lot of different ways of saying ‘profit’ – but each takes different parts of the business into account.
Revenue and cost of sales
Revenue and costs of sales form the basis of the P&L. In most businesses revenue is the primary driver for profit.
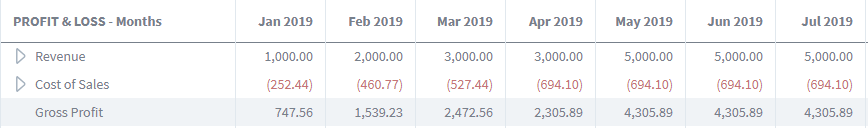
Revenue
Profit
The total money taken for all income streams. Revenue in the P&L shows when money is owed rather than when it is paid. If a sale is invoiced in January, but not paid until March it is recognised in revenue in the P&L in January, but not until March in the cash flow. This makes the P&L revenue line a great way to see how much the business is owed at any given time.
Cost of Sales (COGS / Cost of Goods Sold)
Loss
The costs directly associated with the income – for example the cost of materials used to make a product or the costs of delivering a product or service. Again, these are recorded immediately at the point of transaction in the P&L, regardless of when these costs are paid in cash.
Gross profit
Profit or Loss
Gross profit is the money that the business makes from all of its revenue streams, minus the direct costs of these sales.
What makes gross profit important?
Gross profit is a financial metric that shows how efficient the business is at making money from what it sells. If the business has a low gross profit compared to other similar businesses then it may be paying too much for materials or delivery, or charging too little for its products or services. The healthier (bigger) the gross profit the more money is left to pay for other business expenses, which in turn makes the business less risky.
When forecasting the P&L as part of business planning, gross profit is a good indicator of how stable the business might be – a high gross profit should mean that even if the business gets into financial difficulty or has unexpected expenses, it should be able to quickly recover without spending large amounts on in order to make sales.
Operating costs
Operating costs occur during the day-to-day activities of the business. They do not include the direct costs of sale mentioned above – but include utilities, salaries, insurance – everything that’s required to keep the lights on and the business running smoothly. Marketing which does not directly relate to sales such as billboard advertising could also be included here.
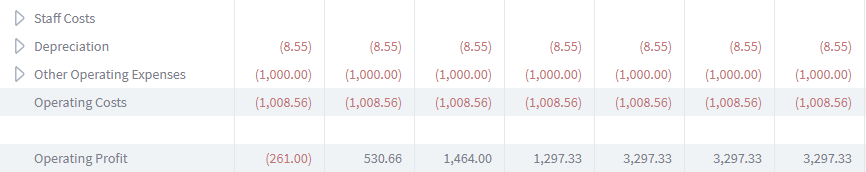
Staff costs
Loss
Staff costs include all costs involved in the employment of people in the business.
Depreciation
Loss
Depreciation is the loss that occurs when assets age and lose value.
Other operating expenses
Loss
Any other costs that are part of the business activities, this may include maintenance costs or rent.
Operating costs
Loss
The total staff, depreciation and other costs.
Operating profit
Profit or Loss
Operating profit is gross profit minus operating costs. In other words – it is the total of all income streams, minus the cost of selling and all other operating expenses. What operating profit does not take into account is any of the gains and losses described further down in this guide – finance costs & income (for example investments, interest and asset sales) and taxation.
What makes operating profit important?
Unlike operating activities on the cash flow forecast report, operating profit includes the loss of value of the company’s assets in the form of depreciation. The inclusion of this depreciation expense arguably presents a more realistic long term picture of the company’s financial health, as the wear-and-tear on assets expressed through depreciation is a sign of future costs to be covered – these assets will require maintenance or replacement in the future.
Because only the core activities of the business are represented in the operating profit line, this is a useful tool for analysing similar businesses with a different tax or financial structures (or predilections to investment/debt).
But operating profit should never be looked at in complete isolation – it omits key parts of the financial picture of the business that are necessary to understand its health.
Finance costs & income
The finance costs & income sections shows the income and outgoings related to operations outside of the regular activities, such as investments, disposal of assets and interest paid and received.
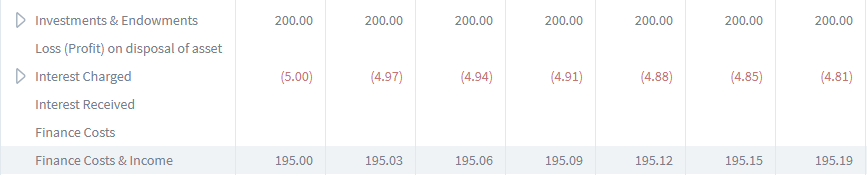
Investments & endowments
Profit or Loss
The income or capital growth produced by any investments the business may have. If an investment the business owns increases or decreases in value, this should be recorded here.
Loss (profit) on disposal of assets
Profit or Loss
The profit or loss from selling or writing off any business resources. This line can be a point of confusion – what exactly counts as a loss or a profit when disposing of an asset? Here are some examples to help clear things up:
- If an asset was purchased for £1000, depreciates to £200 and is then written off, then a loss of £200 would be recorded.
- Whereas an asset was purchased for £1000, depreciates to £200 and was sold for £200 no loss would be recorded.
- If an asset was purchased for £1000, depreciates to £200 and was sold for £400 then £200 profit would be recorded.
Interest charged
Loss
Any charges made for borrowing, such as interest on loans.
Interest received
Profit
Any income made through interest received on savings.
Finance costs & income
Profit or Loss
The sum of investments, profit/loss on selling assets and any interest.
What makes finance costs & income important?
Finance costs shows us the net profit or loss from non-operating activities in the plan. Anything which the business is engaged in that does not relate directly to their sales or operating expenses is included here, highlighting any particularly profitable activities and identifying the burden of interest on the debt that the business has accumulated.
Note that as capital repayments of loans do not result in a profit or a loss (just a repayment of cash the business has already borrowed) they do not appear on the profit and loss forecast.
Taxation and profit
Taxation is separated out from other expenses and income in the P&L, just like in the cash flow forecast. Remember that tax the business collects from its customers does not belong to it! It must be deducted before you can reach your final figure for profit.
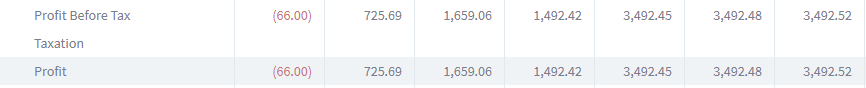
Profit before tax
Profit or Loss
This is the income minus the costs for the entire business which has yet to have tax applied. A modified version of this line is used for some taxes, such as Corporation Tax, as the basis for their tax on profit calculations.
Taxation
Profit or Loss
The amount of tax that the business need to pay in the given period. As we are on the P&L rather than the cash flow, this line shows when tax is accrued rather than when it is paid. This means it will always show how much tax is owed each month, rather than just the (often less frequent) payments of tax to the government.
Profit
Profit or Loss
Simple. Income minus all costs, including taxation.
What makes profit important?
Essays could be written about the importance of profit – but here’s a summary:
Profit is used as a measure of success. Profit is a measure of the monetary return on investment for entrepreneurs and investors who have invested in a business.
It is also used by external organisations, such as banks and lenders, to determine the risk of lending to the business.
Additionally, profit is a source of funding for the business if it is ploughed back into the business rather than removed as dividends.
Dividends and retained surplus
Last but not least – dividends and retained surplus. It’s easy to look at profit and think that is the end point of the P&L Forecast, but these lines determine (in part) what becomes of that profit. Is it given to shareholders in the form of dividends? Or is it retained by the business, adding to the cumulative retained surplus (total profit over time) that the business is generating to fund its own projects and take the burden of funding the business away from debt and borrowing and towards self-sufficiency.
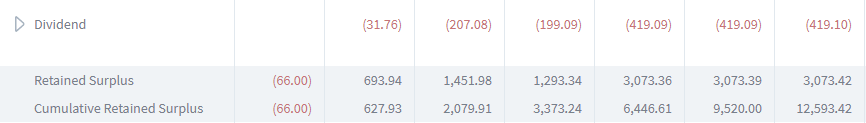
Dividend
The money that the business pays to its shareholders. In Brixx this line can be broken down by each equity component that has been added to the plan to show each outflowing dividend payment based on the profit for that period, or the number of shares owned by shareholders.
Retained surplus
The profit after all dividends are paid out per period.
Cumulative retained surplus
The amassed profit from this month and all previous months after tax and dividend.
Starting to track your profit and loss
Remember that P&L reports are often assembled in slightly different ways, with different names for lines or with different numbers of lines shown for each section – but the universal measures of the P&L are gross profit, operating profit and profit. Comparing these figures between differently formatted P&L reports should be a fair comparison.
Profit and loss, cash flow and balance sheet forecasts are calculated automatically in Brixx from your financial model. Make sure to sign up today.