To begin effective and accurate financial planning for startups, you will need three key reports: a Balance Sheet, a Cash Flow Statement, and a Profit and Loss Statement (sometimes called an Income Statement). From these, you will be able to put together the five main components of your financial projection and use them effectively within your business plan.
They are one of the most important elements of any business plan, so it’s important to get them right. Whether you plan to use them to help you win over investors, obtain bank loans, or produce a long-term growth strategy for your business, financial forecasts can help your business in a number of ways.
Creating financial projections for startups
This post continues on with our topic of creating an effective business plan. Here, we focus on the fact that financial projections are not only essential to a new startup’s business plan. We emphasise that they are also essential to you as a business owner. Financial projections are able to help you gain a solid grasp of your company’s financial health.
As a rule of thumb, your financial projection should be 5 years long, with monthly figures shown for at least the first 12 months. In some cases, you may only be asked for a 12-month projection or a 3-year plan. But you can beat both of these expectations – and there are good reasons to do so.
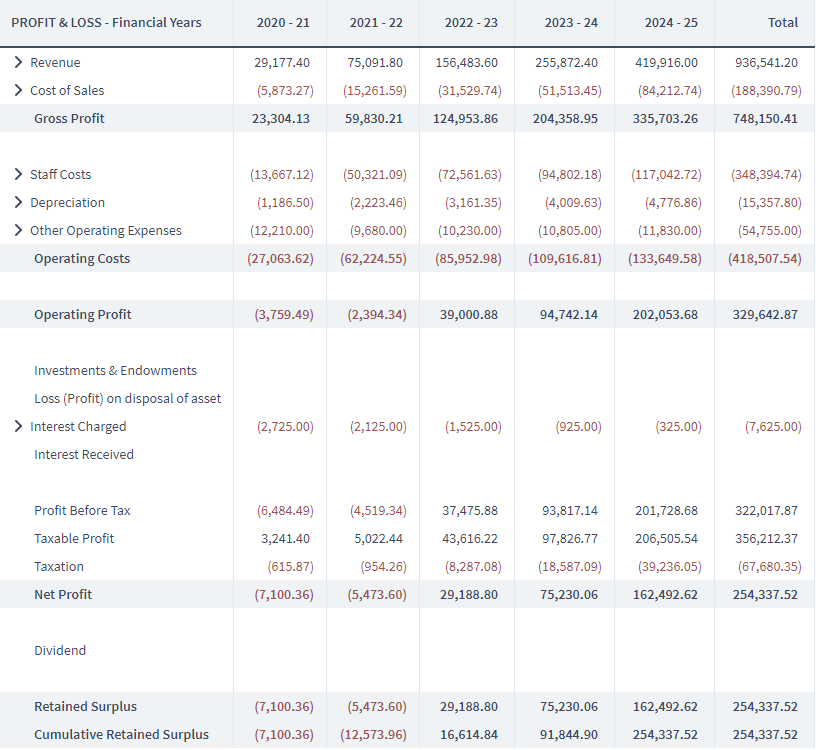
When looking at the above image of a Profit and Loss Statement, it showcases that 5 years is long enough to plan what the business will look like when it has matured, something most startups don’t think about.
Why a 5-year projection?
“But,” I hear you ask, “how can I plan anything accurately over 5 years? I haven’t even started my business yet!”
The answer is – you don’t need to plan accurately that far ahead. Planning accurately more than a few months into the future is impossible. But plans do not need to be 100% accurate – they need to be well informed and grounded in reasonable expectations and research. Any long term plan you make will turn out differently in reality. But right now, making that plan is the only way you can gain insight into what might happen in the future.
A 5-year financial projection gives the business enough time to demonstrate what it will be like after its startup period – when it is fully established and running optimally. 5 years also gives you the potential to look to the future of the business – how it will expand its horizons after getting up and running.
The organisational principles we’ll cover are applicable whether you’re planning in Brixx or creating your own projection from scratch. While Brixx simplifies things for you by completing all of the calculations for your reports and makes it easy to restructure and test your plan, it is entirely your choice whether to use specialised software or spreadsheet for your startup’s financial projections.
What is the aim of using a financial forecast template?
What are we going to get out of it and actually present in our startup business plan? Here’s a quick list.
Three detailed financial reports:
And some quick takeaway information:
- General Assumptions
- Sales Forecasting
- Startup Costs
- Running Costs
- Salaries & Contracts
- Funding Requirements
The three financial reports form the backbone of your financial projection, while the quick takeaway information is an easily digestible way of displaying this information.
Now, the three reports I mentioned above may sound intimidating – and the truth is they use language and concepts which can take a little while to pick up! While they seem a bit alien at first, what’s important to understand is that each report is just a different way of viewing what’s going on financially in your business. Each report is made of the data you have gathered, just arranged in a standardised way. With these reports, you can create a comprehensive financial projection that will elevate your business plan or even an investor pitch.
Keep in mind
It is also worth noting that you should be able to test your financial projections. Why? Well, for a start, that’s what a lot of investors will be asking you for! What happens if sales are lower, or a project doesn’t reach completion on time? What happens if a vehicle breaks down and needs repairs or replacement? Can the business handle this – and what are the knock-on effects? All of these questions and more are easy to answer if every element of your financial plan is a modular component that you can add, change or remove without affecting the validity of the projection’s calculations.
It is crucial to keep record of your projections, documents, etc. Depending on your business plan’s audience, you may need to include items that support your statements and/or figures in the plan. These might include important staff member CVs and detailed market/competitor research data, etc. Some information will go in the appendix section, allowing you to expand on the information you’ve supplied throughout.
Understanding cash flow in your startup’s financial projection reports
The cash that comes into the business, and the cash that goes out of the business. The Cash Flow shows when cash (digital or physical) actually changes hands in these transactions. To me, cash flow is the simplest report to understand, as it shows what is the case at any given time.
Before we move into the next section, you’re going to need a spreadsheet or a piece of software like Brixx to build your Cash Flow Forecast. If you don’t fancy trying Brixx then we also have a free cash flow template which you can build it in too.
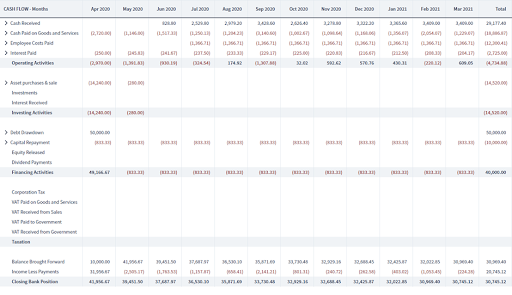
The Cash Flow Report in your financial projections
The Cash Flow Report takes into account when cash actually changes hands. The Profit & Loss Statement accounts for when the transaction agreement takes place. Let’s say you deliver a product/service immediately to your customer and they then pay you a month later. An electrician, for example, might complete some work, and then send an invoice for payment. The electrician’s charge for their work appears on their business’ Profit and Loss Report when they send the invoice, but the cash payment only appears on their business’ Cash Flow Report when they actually get paid by their customers.
This delay between the sale happening and the cash being received is part of what makes the Cash Flow Report so useful. Many businesses, even large and established ones, can suffer from a lack of ready cash. If this business can’t pay its bills this will ultimately lead to the failure of the business. Making a cash flow forecast is a means of looking ahead and trying to foresee and mitigate these problems before they happen. This can be done by identifying the periods and time and areas of the business that are a cause for concern, cash-wise.
Key questions the cash flow can answer:
- How much cash in hand the business has every month
- The consequences of projects, payments or purchases happening at unexpected times
- The toll each type of cash flow has on net cash
- Will the business stay afloat!?
Key cash flow information:
The cash flow is made up of several ‘cash flows’ – each representing different kinds of business activity, as well as ‘bottom line’ totals of these cash flows.
Understanding your Cash Flow Report
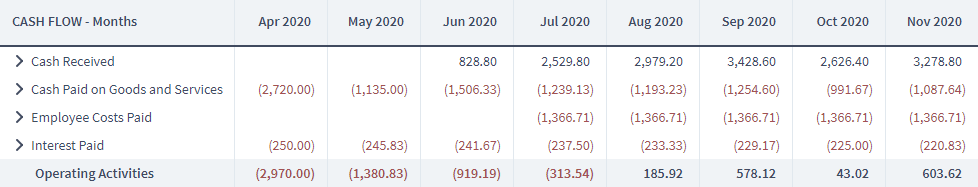
Cash Flows from Operating Activities
The day-to-day operations of the business: income from sales, minus the cost of sales, minus overheads like rent, electricity, paying interest and salaries.
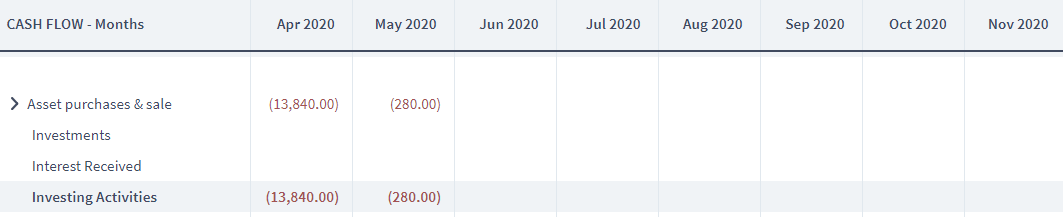
Cash Flows from Investing Activities
The purchase and sale of assets, investments and income gained from interest on savings are recorded here. These are activities that in many cases are outside of the day-to-day running of the business. Initial asset purchases may be necessary to get the business up and running in the first place or replace existing assets that are crucial to the business but they aren’t a regular part of the business’s revenue stream or monthly bills.
Cash Flows from Financing Activities
Financing activities show where the business gets its funding from. Additionally, financing is cash received from sources external to the business, like loans or external investment. These financing cash flows also include dividends the business pays to shareholders and loan repayments to lenders.

Cash Flows from Taxation
The tax you pay and any tax refunds are included here.
Income Less Payments
This line shows the net cash movement in any given month, that is, the total of all the cash flows mentioned above. This is great for helping you identify problem periods of the year.
Closing Bank Position
The real ‘bottom line’, Closing Bank Position shows the amount of cash in your bank account/s at the end of each month. If this goes negative, the business has serious problems. This is why cash flow forecasting is so important, especially for small businesses. Splitting out these different cash flows makes this report easier to understand. It also allows each flow of cash to be compared to the others. You may find for example that you have a healthy operating cash flow but the business’ investing activities are taking too great a toll on the business’s net cash flow to continue unabated.

An overview of profit and loss in your startup’s financial projections
The P&L records the profits and losses made by the business. How do you make a loss? It’s a way of saying that something the business owns has lost value. The P&L takes into account when, or over how long transactions are agreed, rather than when cash actually changes hands.
Key questions the profit & loss can answer:
- What are the business’ Gross Profit, Operating Profit and Profit for a given period?
- Can the business afford to take on new projects?
- What non-cash losses is the business suffering?
- How are dividends related to profit?
Key information on profit and loss
Gross Profit
Gross profit is revenue from sales minus the direct costs of those sales. This is often formulated as a percentage called gross profit margin, showing the cost of selling as a % of the sale.
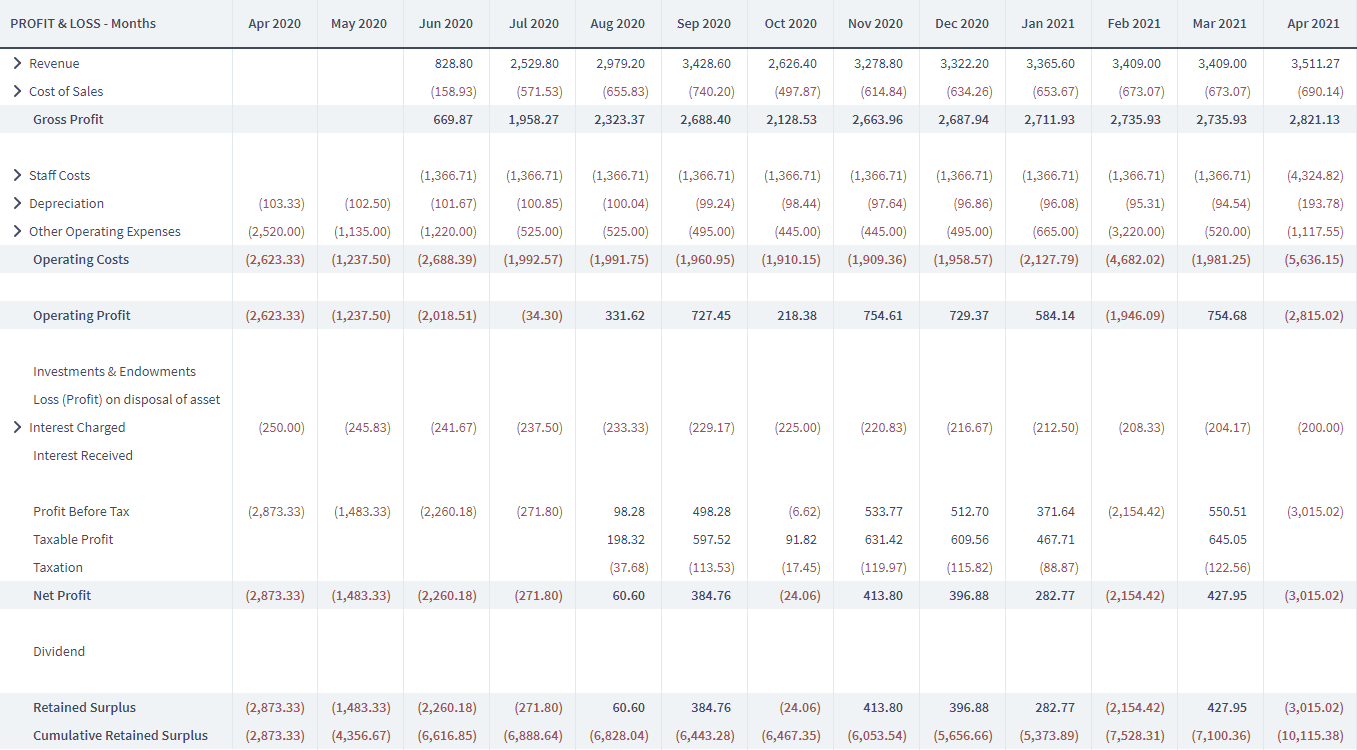
Operating Profit
What is Operating Profit? It is Gross Profit, minus any indirect overheads (cost of goods, services and salaries). Operating profit shows how well the business can support itself by its activities alone. Therefore it is useful gauge for whether a business can take on new projects or other costly activities.

Net Profit
Net profit takes into account all of the business’ extra expenditure that is not taken into account under Operating Profit. This includes investments, interest charged, interest received and taxation.

To read more about the Profit and Loss Report – check out this article: A Beginner’s Guide to the Profit and Loss Forecast Report . If you’re still confused, here’s my attempt at busting the confusion! How to understand the Profit and Loss Statement and why it’s confusing.
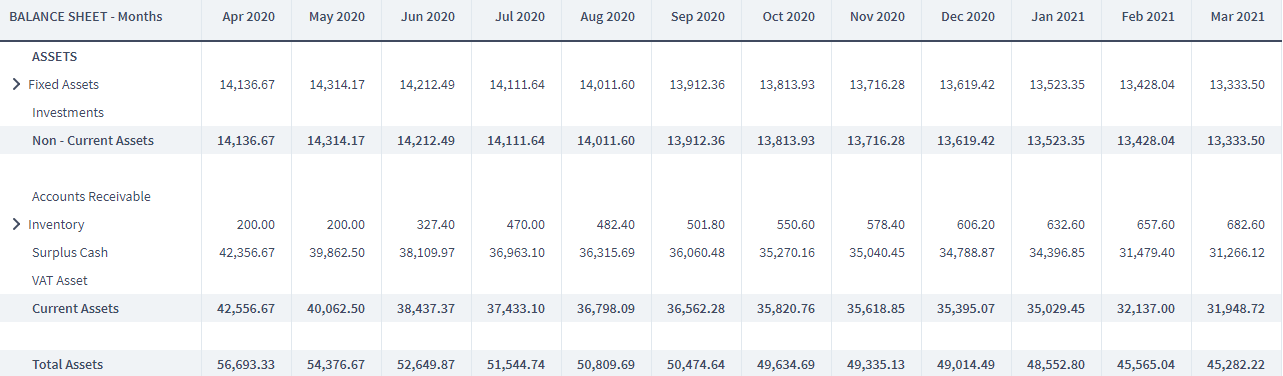
Getting a handle on your financial projection’s Balance Sheet section
The Balance Sheet shows the financial position of the business at any given time. It shows what it owns (assets) balanced with what it owes (liabilities) and the money that has been invested in it (equity).
This all sounds pretty esoteric, but it boils down to “how risky is the business – how much does it own and how much does it owe?”
Key questions the balance sheet can answer:
- Value of the business’s assets
- Size of the business’s debt
- What funds the business, debt or investment?
- How risky is the business for investors?
Information on the Balance Sheet
Assets
These are what the business owns. Assets include physical things like cars and computers, and also cash and investments.
Liabilities
Liabilities are what the business owes. A business with a large ratio of liabilities to assets may be seen as risky as it funds itself with debts which must be paid off, no matter the state of the business.

Equity
Equity shows the net value of the business. It’s the same figure as net assets – the businesses’ assets minus its liabilities. Breaking down equity further, it shows who owns the business, whether this is a single owner or a group of investors.
From these three core reports, you or an accountant should be able to work out any additional information you may be asked for.
Use financial projection templates for more than just your startup’s business plan
Now that we’ve covered financial projections for your startup’s business plan, be sure to download your free Business Plan Template to help you format your plan correctly.
Remember, financial projections are useful for more than just your startup’s business plan or for seeking funding. These plans are able to help you better understand the potential risks you may face.
There are always risks when starting a new business. Your startup business plan document should be a persuasive tool to help get support for your business. However, it should also be honest. The people who look at your business plan, whether they are investors or future-you, need to have the risks and your plans for mitigating them laid out.
In most cases, these risks will be financial in nature. The business doesn’t make enough money – either because the product is not good enough, it can’t attract enough customers, or there is a misalignment between what the business is offering and what the market requires.
With a comprehensive financial projection for your startup’s business plan, you can more easily see potential risk down the line. Brixx can help you reduce the stress and time wastage of setting up spreadsheets and formulae to keep track of and project your financials.