

If you want to understand how your business really grew this year, then YOY growth is your go-to metric. In this article we’ll show you what YOY means, how to calculate it correctly, which growth rates are considered good by industry, and how to avoid the common traps.
What is Year-Over-Year (YOY)?
Year-over-year (YOY) is a simple financial term that is used by businesses to compare data for a specific time period with the same corresponding data from the previous year. It is an easy way to analyse your business’ growth – or decline! – over a twelve-month period.
Get started with our forecasting software so that you can plan your business' future
Track your year-on-year growth in Brixx
What is YOY used for?
Year-over-year (YOY) comparisons are essential for businesses. Some of the common uses of YOY analysis include:
Checking in on business performance
An absolutely key use of YOY is tracking just how well a business is doing over time. For example, if a business wants to learn how this year’s sales compare to last year’s. they’ll look at the YOY numbers. This will show patterns, trends, and more, letting you understand what aspects may need a rethink.
Making sense of financial reports
In financial reports, a YOY report will help give context to earnings or revenue. It will show how those numbers compare to the same time last year, which can be way more meaningful than just looking at raw data. Investors will rely on this data.
Dealing with seasonal ups and downs
There are many industries that will have seasonal upturns and downtimes. These can be retail, tourism, and even farming. A YOY report will smooth that out. Instead of comparing January’s profits to December’s – which would make zero sense – you will compare December this year vs December last year. That way, you’re measuring like-for-like.
Setting budgets and making forecasts
Looking at the year prior is essential as a starting point for setting new goals. YOY analysis will help you and your business set realistic forecasts, as it adds historical context to your numbers.
Helping investors make decisions
As an investor, YOY growth will be an excellent signal. If a business is steadily growing their profits each year, that’s usually a good sign. Inconsistent growth or declining profits will raise red flags.
At the end of the day, a YOY comparison will give you a much clearer view as to how things are progressing over time. YOY data can help you make smarter, better-informed decisions.

How do you calculate YoY growth?
It’s easy to figure out YOY growth. It’s just a simple way of measuring something like sales this year vs last year.
This is how you calculate it step by step:
- Step 1: Make sure you have the numbers that you want to compare at hand. You will need the numbers from this year, and the numbers from last year.
- Step 2: Subtract last year’s numbers from this year’s. This will show the overall change.
- Step 3: Divide the resulting difference by last year’s value. This will show the change compared to when you started.
- Step 4: Finally, you can multiply that resulting figure by 100 to turn it into a percentage. That way, it’s easy to see how much growth (or decline) there’s been.
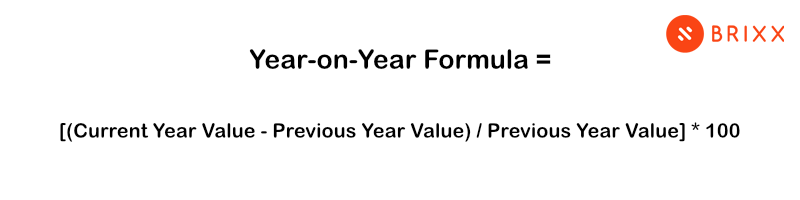
YoY Formula
We’ve listed the formula below to calculate YOY growth:
YOY Growth = [(Current Year Value – Previous Year Value) / Previous Year Value] * 100
YoY calculation example
We’ve got a quick example to show you in using the calculation. We have created a false set of figures for a business:
- Current year revenue: £500,000
- Previous year revenue: £400,000
Step 1: Obtain the data you need
- Current year revenue: £500,000
- Previous year revenue: £400,000
Step 2: Calculate the difference between the two
- £500,000 – £400,000 = £100,000
Step 3: Divide the result by the previous year’s value
- £100,000 / £400,000 = 0.25
Step 4: Multiply by 100 to get the percentage growth:
- 0.25 * 100 = 25%
As you can see, the YOY growth in revenue for the company is a resulting 25%. This means that the business revenue has actually increased by 25% from the prior year!
What is a good YoY growth rate?
Figuring out what a good YOY growth rate is can be challenging – especially as each industry has a different set of standards. It can depend on size, stage, and financial situation. There isn’t an answer that can be applied to all businesses.
For large businesses, a growth rate of around 5% – 10% can be considered really positive. This is a stable amount, as businesses of a larger size have increased difficulty in ensuring they retain profitability.
However, smaller businesses may experience a much higher growth rate – especially when the scale. Anything from 20% to 50% is feasible.
When assessing, it’s important to note the global economy as well. During slower periods, a positive YOY growth rate can be much harder to obtain.
All in all, there are many factors to consider. You have to look at your business’ industry, competitors, historical performance, and more. The most important thing by far is ensuring that your growth rates align with your objectives.

Benefits of YOY
There are many benefits associated with YOY analysis. We’ve listed a handful of these below:
1. It shows the big picture
Instead of obsessing over the short-term wins and losses, YOY will give context to overall long-term patterns. Comparing YOY helps show what’s working and what isn’t – and where you’re heading next.
2. It can help to spot growth opportunities
If you spot something in your reports that shows a particular service or product had strong YOY growth, you can assess and double down. Take what works, and improve upon it.
3. It measures how well your marketing is working
A look at YOY data will show whether or not your marketing campaigns are actually working or not – and if not, it will help you to guide your next moves.
4. It helps to see how you compare with competitors
Using YOY figures and comparing them to others in your industry allows you to see whether or not you’re keeping pace or falling behind. This benchmarking is essential for staying competitive and improving your business.
5. It allows you to goal-set with growth in mind
Instead of looking at your finances and having to guess what your next moves are, YOY data provides concrete evidence as to how to build your plans. It will help to set targets that are both realistic and ambitious!
6. It flags any potential problems early
A loss in YOY growth isn’t always the worst thing in the world, but it can be a huge warning sign. If growth begins to slow, it’s worth digging into the reason why ASAP – before it gets worse!
7. It supports smarter decisions
With a full year of context, your figures will tell you more and help you to make better choices going forwards. YOY will highlight you the trends that you need to improve upon.
YOY analysis is invaluable as a tool to help gain real insights into your performance.
Limitations of YoY analysis
While YoY analysis is useful, it has its drawbacks:
- YoY ignores short-term changes: Doesn’t capture recent trends or fluctuations.
- There are seasonality distortions: Yearly comparisons may not account for seasonal industries.
- Detail can often be lacking: A YOY analysis will show the figures, but won’t perhaps show why a change occurred. This will require deeper analysis.
- Sometimes there can be data gaps: A new business may lack the historical data required to compare effectively.
To get a full picture, your business should use YoY alongside many other metrics, like quarter-over-quarter (QoQ) or moving averages.
What about comparisons that aren’t yearly?
Now, YOY analysis is a very common way to assess financial progress. However, it isn’t the only way! Some of the alternatives to YOY analysis include:
Quarter-over-Quarter (QOQ)
QOQ analysis will help you to compare data from one quarter in a year with another. It can be really helpful in understanding your business – especially if your business has significant seasonal changes.
Month-over-Month (MoM)
MoM analysis compares data for the same month in different years. It can often help in reviewing any short term trends, and also helps to identify the more immediate fluctuations in your metrics.
Compound Annual Growth Rate (CAGR)
CAGR will help you to measure the annual growth rate of an investment or a financial metric over a period of multiple years.
Moving averages
Moving averages can help you to smooth out any fluctuations in data by helping to calculate the average over a specific number of periods. This can help your business to identify any trends more easily.
Sequential growth
Sequential growth can help you to compare data from the start of a year to data from the same point in a previous year. It provides insights into short-term changes.
Year-to-Date (YTD)
Year to date analysis will show you the data from the start of the year to the current working date – and then compare it to the same period of time in the prior year.
The choice of method will depend on your business and it’s specific objectives. Each approach has advantages and limitations, and we recommend that your business uses most – if not all – of them to gain comprehensive insights!

Common YoY financial metrics
Year-over-year (YoY) analysis is widely used in financial reporting to track trends over time. Common YoY financial metrics include:
- Revenue growth – Measures how sales revenue changes annually.
- Net income – Assesses profitability shifts year-over-year.
- Inflation rate – Compares annual price increases across economies.
- Stock performance – Evaluates a company’s share price growth.
- Customer growth – Tracks changes in user or subscriber numbers.
These metrics help businesses identify patterns, assess financial health, and make data-driven decisions.
Master financial forecasting with Brixx
A financial forecasting software like Brixx will help you in assessing all of this data – and more!
Brixx has amazing features that can help you to track a whole host of metrics, alongside automating financial reports for your investors and colleagues.
Try using Brixx for free to stay on top of your finances and manage your growth. Track YoY data and make informed business decisions.
Common YoY FAQs
Is YOY the same as year-on-year?
Yes, “YOY” stands for “year-over-year,” which means the same thing as “year-on-year.” Both terms compare data from one year to the same period in the previous year.
Can I use YOY for expenses?
Absolutely. YOY analysis isn’t just for revenue. You can compare expenses, profit, customer numbers, or any other metric to see how it has changed over time.
When is YOY misleading?
YOY can be misleading if your business or the market has changed significantly within the year. It can also hide short-term trends, so it’s best to use it alongside monthly or quarterly comparisons for a full picture.