

As a business owner or entrepeneur, you may not have a complete understanding of your forecasts vs your actuals. There will always be at least some differences (hopefully small), but some could be significant. Keeping track of them is key to understanding your progress towards your long term business goals.
What are forecasts compared to actuals?
What are forecasts?
Forecasts are the predicted or estimated values of your finances. Across all industries, forecasts are made to anticipate future outcomes or events. These are typically based on available data, historical patterns, mathematical models, and other relevant factors.
What are actuals?
Actuals, on the other hand, represent the real data or outcomes that occur after a specific period has elapsed or an event has taken place. Actuals are the factual and verifiable measurements or observations of what actually happened.
Learn more about what an actual is in accounting.
How do actuals and forecasts work together?
Comparing forecasts to actuals is a way to assess the accuracy and reliability of the predictions. It allows for an evaluation of how well the forecasts aligned with the real-world outcomes. By analyzing the differences between forecasts and actuals, one can identify the strengths and weaknesses of the forecasting methods, models, or techniques employed. This information can be used to improve future forecasts and make more informed decisions.
Analysing your real world performance in Brixx
Within Brixx you are able to create detailed and clear forecasts. Tracking and comparing these to your real world performance can be done by utilising our actuals vs forecast feature, otherwise it involves tracking all finances in Excel and spending additional time building your own comparison spreadsheet.

Why should you track your actuals against forecast?
Tracking how your business performs is a critical process to growing a business. It forces you to take your head out of the day to day grind, look up, and check where you’re going. Is it all going to plan? Is your strategy still the right one?
It’s a discipline that helps you identify if you are meeting your original aims and highlights where changes are needed. Doing this early and often will allow you to make course corrections before it’s too late. Perhaps you are going in the right direction but not as quickly as your original projections suggested. You need to know that information as soon as possible so you can judge the potential ramifications on your long term cash flow and perhaps even funding requirements.
Staying on track
Measuring, testing and implementing improvements is essential for any company looking to achieve high growth. It will help you:
- Track progress toward your goals
- Stay in budget
- Double-down on activities that are working well
- Change activities that aren’t working well
- Make better forecasts
The last point might be easy to overlook. Forecasts are built on assumptions. Assumptions about number of customers, conversion rates or product release dates (for example). Comparing your actual results with your forecast will put your original assumptions to the test and help you identify where they were wrong and, crucially, why they were wrong.
Understanding this will help you make more realistic assumptions and create more accurate forecasts going forward. Ultimately, this ensures you make the better decisions based on more accurate information.
Get started with our forecasting software so that you can plan your business' future
Compare forecasts and actuals in Brixx
Introducing actuals in Brixx – make better decisions with real data
We’ve built an extensive update to help your business with this process and ultimately help your achieve your goals! We’ve been keen to deliver real value that allows you to achieve a planning process that will aid your success.
Adopt a best practice planning process that drives business growth
- Create forecasts based on assumptions
- As real data comes in, compare this to your forecast
- Adjust your assumptions and implement necessary changes to your business
- Repeat
You’ll can execute all of these activities all within Brixx, saving you time and improving your decision making process.
Adding your real data to Brixx
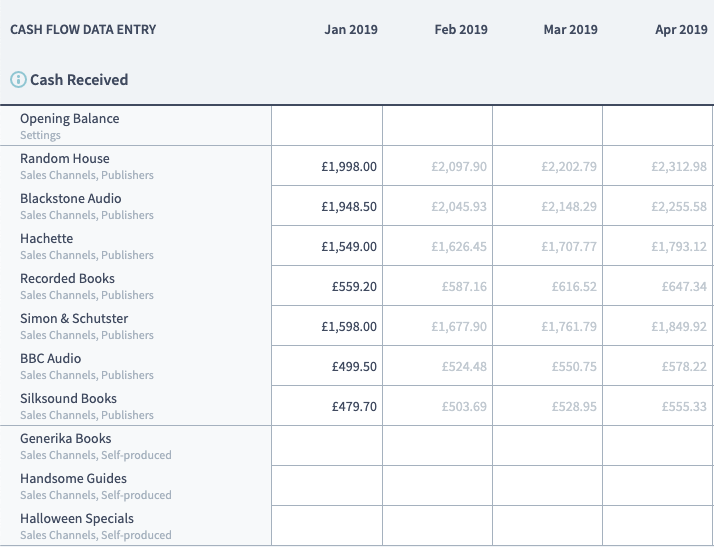
In order to do this within Brixx, you need to access the top menu called ‘Actuals’.
The forecast you’ve built in Brixx becomes the template for your actuals. Each month, you’ll be able to assign your actual results against all the activities in you forecast, at the most detailed level. It’s critical that it’s at this detailed level and not just the top account since this is how’ll you’ll get meaningful results you can make decisions from.
Analysing your actuals
This area is broken down by the 3 key financial reports – cash flow, profit & loss, and balance sheet statements. You can find downloadable templates for these below:
They are further split out by report headings and consist of editable rows that are dynamically created to match your forecast. You can see your forecast in the background of each cell before you enter your real figures to help identify what you’re looking at. This is where the app does the heavy lifting, taking away the need to build your own spreadsheets.
You can quickly copy and paste figures in from any source of data. Or, if you have a number of fixed costs, you can double click a cell and it will pre-fill with your forecast value. Pressing ‘Enter’ will confirm and move down a row, pre-filling the next cell with your forecast. If you have a number of actuals that stay the same each month they can be filled in seconds.
Updating your actuals each month will take a few minutes of your time and will provide the information you need to stay on track and grow your business.
Once you’ve updated each month, you can analyse the results in the variance reports that are automatically generated for you.
Automatic variance reports
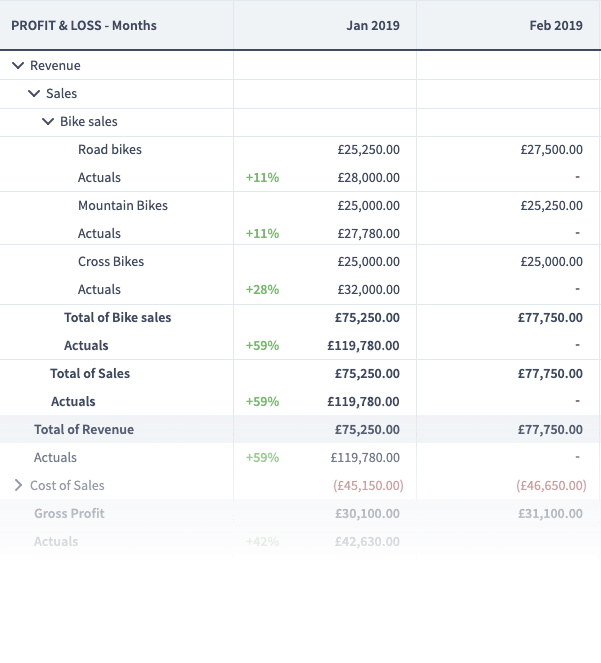
A variance report is a fancy name for analysing the difference between your actuals and forecast. On the normal cash flow, profit & loss, and balance sheet reports you can now tick the ‘Show actuals’ option to begin comparing results
When you first land on an actuals vs forecast report, you’ll see the top level report lines as per normal. You’ll also see your actual results and the percentage difference between the two values. However, like any Brixx report, you can drill into these lines to reveal several different levels of detail and unpack the top account line to find out what it’s made up from.
- Learn more: What is the normal balance of accounts?
Seeing the insights
If you’ve organised your income sources by department, channel, category, etc, you’ll be able to compare how each have performed. This applies across the entire set of reports meaning you can delve into any area of your business to see the detail.
You’ll see the actual value and variance at any level you choose. It’s really powerful because you can truly dig into your results to find out what’s working and what isn’t.
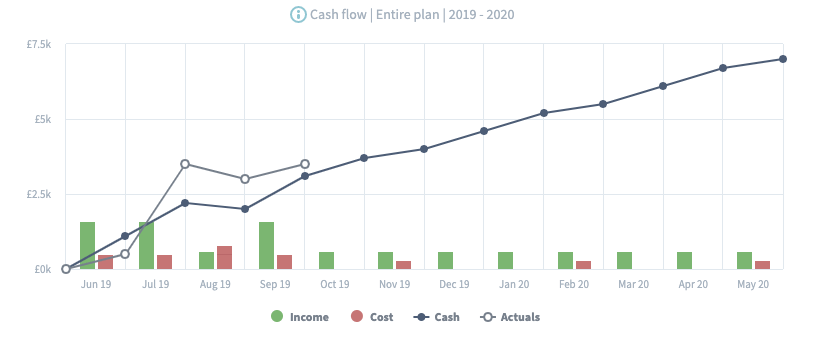
The cash flow chart on the dashboard will also update giving you a comparison of your cash position each month.
Presenting your business performance
The power to drill into any number and see the variance at any level will help you explain to investors and colleagues where your success is coming from or quickly identify problems.
If you haven’t explored the Brixx sharing features, you can share these reports to anyone who has a Brixx account. You can even make live updates for others to see in real-time.
Actuals are entered at the monthly level but when it comes to the variance reports, you’ll be able to roll them all up into quarterly and yearly views – again, calculating your totals and comparing them at any level you choose. This gives you the flexibility to conduct monthly, quarterly or annual reviews with your team.
Track actuals vs forecast in Brixx
We have added actuals vs forecast to Brixx. Check out the full list of comprehensive features and make sure to sign up to a free trial to take advantage of our financial modelling tool.